Download de presentatie
De presentatie wordt gedownload. Even geduld aub

1
Diabetes type 2 : Orale antidiabetica
Terugkomdagen Diabeteseducatoren 2009 Dr. G. Vanhaverbeke

2
2008 was een historisch jaar in Diabetes type 2 familie
Waarom ?

3
Puzzle vraag : “Slimste Diabetes Educatorr”
Puzzle vraag : “Slimste Diabetes Educatorr” Allen overleden in 2008 – Hugo Claus,

4
Waar kunnen/moeten jullie in blijven uitblinken
Eerst wat clichés Waar kunnen/moeten jullie in blijven uitblinken

5
Wat is diabetes type 2 NIET…
…een beetje suiker…. …een ouderdomsziekte…. …een acute aandoening…. …iets dat je geneest….. …pancreas maakt te weinig insuline….

6
Diabetes is wel …….. Een Progressieve ziekte van de bloedvaten…
Waarbij we proberen de CHRONISCHE COMPLICATIES te voorkomen Met beperking van het aantal ACUTE COMPLICATIES

7
Diabetologie is…. voornamelijk veel Babbelwater, babbelwater…
Diabetologie is….voornamelijk veel Babbelwater, babbelwater….kost veel tijd : PATIENT EMPOWERMENT De patient motiveren om er iets aan te doen De patient kennis meegeven waardoor hij weet waar het over gaat De patient de middelen aanreiken waardoor hij weet waar het over gaat ZONDER VERLAMMEND TE WERKEN

8
Diabetes is zeker … Een aparte soort geneeskunde
Niet iets dat je geneest door een ingreep of medicatie Een geneeskunde die werkt met doelstellingen die dienen gehaald te worden Een voortdurend streven naar “ goede resultaten “, wetende dat het ganse leven (sociaal,economisch, medische, culinaire…) er een invloed op heeft Voortdurende ingreep op privacy van patient Eeuwige controle (zelf maar ook omgeving) Een progressieve ziekte
 er een invloed op heeft. Voortdurende ingreep op privacy van patient. Eeuwige controle (zelf maar ook omgeving) Een progressieve ziekte.")
9
Casuistiek You have the answer

10
Casus 1a Man, 45 jaar Vaststelling glucosurie op het werk….?

11
Goed begonnen is half gewonnen…
De diagnose stellen diabetes type 2 is niet iets dat er “bij komt” : KOST VEEL TIJD Babbelwater, babbelwater : Informeren Met als doel motiveren Zonder te choqueren of te verlammen Onmiddellijk doelstellingen geven… Huisarts speelt de centrale rol (niet we gaan dan eens je suiker moeten bekijken, want hij staat wat te hoog…)
")
12
Middelen aanreiken aan de patient zodat hij kan communiceren : ROL van EDUCATIE
Begrippen leren : Glycemie, HbA1c… Uitleggen aan patient wat is diabetes type 2 Complicaties uitleggen Belang van dieet en dan vooral gewichtsreductie Belang van andere cardiovasculaire risicofactoren Belang van Beweging uitleggen Belang van follow up : STRUISVOGELTHEORIE

13
1% Lessons from UKPDS: Better control means fewer complications
EVERY 1% reduction in HBA1C REDUCED RISK* 1% -21% Deaths from diabetes -14% Heart attacks -37% Microvascular complications -43% Peripheral vascular disorders *p<0.0001 UKPDS 35. BMJ 2000; 321:

14
Goals HbA1c lager dan 6.5% Bloeddruk lager dan 130/80 mm Hg Lipiden
LDL cholesterol onder de 100 mg/dl HDL cholesterol hoger dan 40/50 (vrouwen) mg/dl triglyceriden lager dan 150 mg/dl Aspirine (> 40j) BMI < 25 kg/m² ROOKSTOP !!!! LICHAAMSBEWEGING!!!!DIEET!!!!
 mg/dl. triglyceriden lager dan 150 mg/dl. Aspirine (> 40j) BMI < 25 kg/m². ROOKSTOP !!!! LICHAAMSBEWEGING!!!!DIEET!!!!")
15
Follow up Elke diabetes patient verdient 3 tot (maximaal) 6 maandelijks een HbA1c bepaling Jaarlijks obligatoir nazicht oftalmologisch Jaarlijks nazicht andere cv risicofactoren Jaarlijks nazicht microalbuminurie Elke raadpleging nazicht voeten !!!!! Bloeddruk !!!!!! Cardiovasculair nazicht

16
“ Slimste Diabetes Educator ”
“ Slimste Diabetes Educator ” The losers van 2008, Ignace Cromber, Yves Leterme Gilbert Bodart,

17
Casus 2 Man 48 jaar MVG : Arteriele hypertensie
Fam VG: vader AMI 50jaar, moeder DM 2 HbA1c 7.5 % R/ Lipitor 20 mg, Coversyl 4 mg, Quid ?

18
Insulin Resistance Syndrome
+ Obesity + Insulin resistance + Hyperinsulinaemia (initially) + Type 2 diabetes or impaired glucose tolerance + Dyslipidaemia + Blood pressure + Atherosclerosis DeFronzo, Ferrannini. Diabetes Care 1991; 14 (3):
 + Type 2 diabetes or impaired glucose tolerance. + Dyslipidaemia. + Blood pressure. + Atherosclerosis. DeFronzo, Ferrannini. Diabetes Care 1991; 14 (3):")
19
Casus 2 : bijkomende informatie
BMI 27 Creatinine 1.2 mg/dl LDL cholesterol 120 mg/dl

20
Type 2 Diabetes - Insulin Resistance and Progressive ß-cell failure
Hyperinsulinaemia Increasing insulin resistance Impaired glucose tolerance Hyperglycaemia / TYPE 2 DIABETES ß-cell failure Hypoinsulinaemia Adapted from Edelman SV. Advances in Int Med. 1998; 43 (Ch 14) :
 :")
21
Reduces hepatic glucose output Reduce Insulin Resistance
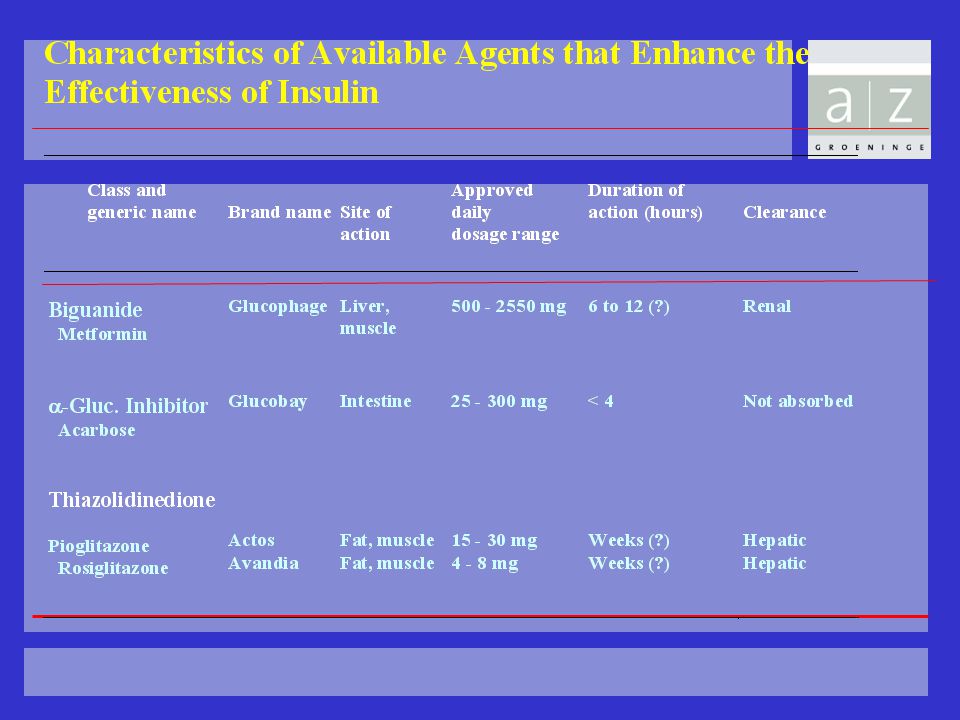
Treatments for Type 2 Diabetes Glucose (G) Carbohydrate Glucose DIGESTIVE ENZYMES Insulin (I) I G Acarbose Reduces absorption - Sulphonylurea Repaglinide Stimulates pancreas + Metformin Reduces hepatic glucose output (??muscle/fat effects) Thiazolidinediones Reduce Insulin Resistance
 Carbohydrate. Glucose. DIGESTIVE. ENZYMES. Insulin. (I) I. G. Acarbose. Reduces. absorption. - Sulphonylurea. Repaglinide. Stimulates pancreas. + Metformin. Reduces hepatic glucose output. ( muscle/fat effects) Thiazolidinediones. Reduce Insulin Resistance.")
23
Biguaniden Docmetformi (°Docpharma) : 500-850 mg
Glucophage (°Merck) : mg Merck-metformine (°Merck) : mg Metformax (°Menarini) : 850 mg deelbaar !! Metformiphar (°Unicophar) Actiemechanisme : verhogen gevoeligheid lever en perifere weefsels verhogen van GLUT 4 transporters inhibitie gluconeogenese verhoging glycogeen synthese Incretine effect
 : mg. Merck-metformine (°Merck) : mg. Metformax (°Menarini) : 850 mg deelbaar !! Metformiphar (°Unicophar) Actiemechanisme : verhogen gevoeligheid lever en perifere weefsels. verhogen van GLUT 4 transporters. inhibitie gluconeogenese. verhoging glycogeen synthese. Incretine effect.")
24
Biguaniden Andere effecten : verlagen LDL, TG en FFA Gewichtsverlies
Dosis : zo maximaal mogelijk tot max. 3 maal 850 mg Nevenwerking : 1. GI 2. Lactaaintolerantie 3. CI : lever en nierfalen (creat >1.4 bij vr en bij man > 1.5), % is intolerant M.O.- Bij nevenwerkingen terug naar vorige dosis en na 2 weken opnieuw pogen op te drijven - Bij contraststof onderzoek of operatie pas opnieuw starten als normale nierfunctie
, % is intolerant. M.O.- Bij nevenwerkingen terug naar vorige dosis en na 2 weken opnieuw pogen op te drijven. - Bij contraststof onderzoek of operatie pas opnieuw starten als normale nierfunctie.")
25
Thiazolidinediones: wie en wat?
Produkten Troglitazone ( Rezulin ) ° Parke Davis (uit de handel genomen omwille van hepatotoxiciteit ) Pioglitazone ( Actos ) ° Eli Lilly mg Rosiglitazone ( Avandia ) °GSK 4-8 mg werken in op de insulineresistentie PLEIOTROOP effect : insuline sensitizer thv lever, vetcel en spier minder circulerend insuline geen hypo’s bewaren van de pancreatische insulinesecretie
 ° Parke Davis (uit de handel genomen omwille van hepatotoxiciteit ) Pioglitazone ( Actos ) ° Eli Lilly mg. Rosiglitazone ( Avandia ) °GSK 4-8 mg. werken in op de insulineresistentie PLEIOTROOP effect : insuline sensitizer thv lever, vetcel en spier. minder circulerend insuline. geen hypo’s. bewaren van de pancreatische insulinesecretie.")
26
Molecular Targets of PPAR{gamma} and PPAR{alpha} Action
Yki-Jarvinen, H. N Engl J Med 2004;351:

27
Fat the key problem Adipose tissue is more than a storage depot

28
Mechanisme van actie van TZD
PPAR gamma : - is nodig voor normale adipocyt differentiatie en proliferatie (FFA uptake and storage) - zorgt voor verhoging FFA storage - fatty acid flux into adipocytes TZD zorgt voor verhoging van small adipocyten, verhogen subcutane vetmassa’s “Fatty acid steal hypothese” zorgen voor verhoogde opname van FFA in vetcellen : op die manier geen opname van FFA in skeletspier, lever, pancreascellen KEEP FAT Where IT BELONGS ADIPOSE TISSUE IS THE MOST IMPORTANT ACTION OF TZD
 - zorgt voor verhoging FFA storage. - fatty acid flux into adipocytes. TZD zorgt voor verhoging van small adipocyten, verhogen subcutane vetmassa’s. Fatty acid steal hypothese zorgen voor verhoogde opname van FFA in vetcellen : op die manier geen opname van FFA in skeletspier, lever, pancreascellen. KEEP FAT Where IT BELONGS. ADIPOSE TISSUE IS THE MOST IMPORTANT ACTION OF TZD.")
29
PROACTIVE en ADOPT PROACTIVE trial ADOPT trial
Adding Pioglitazone on existing therapy : aantal Acute coronaire symptomen daalt, maar hartfalen ADOPT trial Vgl glyburide, metformin en rosiglitazone in monotherapie Later falen van therapie maar Gewichtstoename, oedemen en voorarm fracturen bij vrouwen We wachten af wat verdere studies ons zullen leren, want een grote metaanalyse toonde een toename in cardiovasculaire mortaliteit

30
Contraindicaties voor Glitazones (Diabetes Care 2003)
Voorgeschiedenis van hartfalen Voorgeschiedenis van hartinfarct of symptomatisch coronair lijden Hypertensie Linker ventrikelhypertrofie Significant aorta of mitraliskleplijden Meer dan 70 jaar Meer dan 10 jaar diabetes Preexisterend oedeem of actueel gebruik van diuretica Ontwikkeling van oedeem of gewichtstoename Insuline coadministratie Chronisch nierfalen (creatinine > 2 mg:dl)
")
31
Slimste Diabetes Educator
Slimste Diabetes Educator The winners van 2008, Barak Obama, Loft mat Depauw Bart en Eric VanLooy,

32
Casus 3 Man Nu 49 jaar Hba1c’s : 7,2 – 6.5- 6.7- 6.8 – 8 %
Nu R/ Glucophage 850 mg 2D, Zocor 20 mg, Asaflow 80 mg, Coversyl 4mg, Quid ?

33
Type 2 diabetes Diabetes type 2 Insulin -cell resistance dysfunction
Een progressieve metabole ziekte gekarakteriseerd door Type 2 diabetes Insulin resistance -cell dysfunction

34
Approximate time, years
Therapie is dynamisch doorheen de ziekte Parameter (NHANES) 100 Diabetes diagnosed Monotherapy failure Requiring insulin 80 Monotherapy Dual-drug regimens Multidrug combination +/– insulin Insulin- based regimens 60 β-cell function, % 40 20 Prediabetes Diabetes -10 10–20 Approximate time, years NHANES=National Health and Nutritional Examination Survey. Lebovitz HE. Med Clin N Am. 2004;88:847–863; Turner RC et al. JAMA. 1999;281:2005–2012; UKPDS 16. Diabetes. 1995;44:1249–1258; Warren RE. Diabetes Res Clin Pract. 2004;65:S3–S8; Resnick HE et al. Diabetes Care. 2006;29:531–537; Koro CE et al. Diabetes Care. 2004;27:17–20. 25
 100. Diabetes diagnosed. Monotherapy. failure. Requiring insulin. 80. Monotherapy. Dual-drug. regimens. Multidrug. combination. +/– insulin. Insulin- based. regimens. 60. β-cell function, % Prediabetes. Diabetes –20. Approximate time, years. NHANES=National Health and Nutritional Examination Survey. Lebovitz HE. Med Clin N Am. 2004;88:847–863; Turner RC et al. JAMA. 1999;281:2005–2012; UKPDS 16. Diabetes. 1995;44:1249–1258; Warren RE. Diabetes Res Clin Pract. 2004;65:S3–S8; Resnick HE et al. Diabetes Care. 2006;29:531–537; Koro CE et al. Diabetes Care. 2004;27:17–")
35
Insulin augmenting agents : SU
Short acting (administration before meals): Diamicron-Glurenorm Long acting (once daily): Amarylle, Uni-Diamicron Neveneffecten : Hypo’s en gewichstoename Wanneer ? In associatie met metf/glit of als monotherapie bij intolerantie voor Metf/Avandia
: Diamicron-Glurenorm. Long acting (once daily): Amarylle, Uni-Diamicron. Neveneffecten : Hypo’s en gewichstoename. Wanneer In associatie met metf/glit of als monotherapie bij intolerantie voor Metf/Avandia.")
36
Characteristics of commonly used sulfonylurea
Generic name Brand name Posology Duration of action Excretion (h) (Tolbutamide) Rastinon (Tolazamide) Tolinase (Chlorpropamide)Diabinese mg/d 60 Renal Glibenclamide Daonil mg/d 60 Renal Euglucon 5/Bevoren 5 Glipizide Glibenese mg/d < 24 Renal 80% Minidiab 5 Gliquidone Glurenorm mg/d 7 Hepatic 95% Gliclazide Diamicron 80 Merck Gliclazide mg/d < 24 Renal 70% Glimepiride Amarylle 2/3/4 1-8mg/d 24 Renal 60%
 (Tolbutamide) Rastinon. (Tolazamide) Tolinase. (Chlorpropamide)Diabinese mg/d 60 Renal. Glibenclamide Daonil mg/d 60 Renal. Euglucon 5/Bevoren 5. Glipizide Glibenese mg/d < 24 Renal 80% Minidiab 5. Gliquidone Glurenorm mg/d 7 Hepatic 95% Gliclazide Diamicron 80. Merck Gliclazide mg/d < 24 Renal 70% Glimepiride Amarylle 2/3/4 1-8mg/d 24 Renal 60%")
37
Long acting SU’s Amarylle glimepiride 1-8 mg/dag werkt 24 uur
60 % renale excretie Uni Diamicron 30 mg dagelijks 1 tot 4 co in 1 orale inname duur 12 uur switch 1 tablet 80 mg DM = 1 co UniDiamicron

38
Novonorm Insulin-augmenting agents: Glinide
Novonorm (1 mg, 2 mg, max 12 mg/d) When: early diagnosis of diabetes type 2, postprandial hyperglycemia problem, adding to metformin
 When: early diagnosis of diabetes type 2, postprandial hyperglycemia problem, adding to metformin.")
39
Characteristics of Metiglinides
Generic name Brand name Posology Duration of action Excretion (h) Repaglinide Novonorm 2-12 mg/d 6 Hepatic Nateglinide Starlix mg/d 4 Hepatic
 Repaglinide Novonorm 2-12 mg/d 6 Hepatic. Nateglinide Starlix mg/d 4 Hepatic.")
40
Mengpreparaten Glucovance Avandamet

41
“Slimste arts van Wevelgem”
“Slimste arts van Wevelgem” Studio 100

42
Casus 4 Vrouw MVG : arteriele hypertensie, dyslipidemie
Fam VG : AMI bij vader, moeder DM2 Intolerantie voor GLucophage : diarree 52 jaar HbA1c 8 % R/ Zestril 20 mg, Glurenorm 3 maal 1

43
Casus 4 Zelfde man 48 jaar Geen controles geweest :
Nu bij AMI : HbA1c 11 % R/ GLucophage 2 maal 850mg, Zocor 20 mg, Asaflow 80 mg,Coversyl 4 mg

45
“ Slimste Diabetes Educator “
“ Slimste Diabetes Educator “ Lippens, Bush, Millequet Joelle

46
Probleem van de huidige OAD
Geen blijvende effectiviteit : “Natural history of the disease” Gewichtstoename Hypo’s

47
Time From Randomization (y)
UKPDS MAIN STUDY Effect of Treatment on HbA1c 9 Conventional (10-y cohort) Intensive (10-y cohort) 8 ADA action Conventional (all patients) Median HbA1c (%) Intensive 7 (all patients) ADA goal 6 6.2% upper limit of normal range Al deze behandelingen ten spijt zien we toch dat de beta cell functie achteruitgaag in de loop van de jaren Dit wordt mooi beschreven in UKPDS waar we zien dat zowel bij de conventionele behandeling als bij de intensieve behandeling er toch een achteruitgang is van het HbA1c in de loop van de jaren : men spreekt van de Natural history of the disease 3 6 9 12 15 Time From Randomization (y) Adapted from UK Prospective Diabetes Study (UKPDS) Group. Lancet. 1998;352:
 Intensive. (10-y cohort) 8. ADA action. Conventional. (all patients) Median HbA1c (%) Intensive. 7. (all patients) ADA goal % upper limit of normal range. Al deze behandelingen ten spijt zien we toch dat de beta cell functie achteruitgaag in de loop van de jaren. Dit wordt mooi beschreven in UKPDS waar we zien dat zowel bij de conventionele behandeling als bij de intensieve behandeling er toch een achteruitgang is van het HbA1c in de loop van de jaren : men spreekt van de Natural history of the disease Time From Randomization (y) Adapted from UK Prospective Diabetes Study (UKPDS) Group. Lancet. 1998;352:")
48
UKPDS METFORMIN SUBSTUDY Gain of Weight During Treatment
UKPDS METFORMIN SUBSTUDY Gain of Weight During Treatment 10 Conventional (200) Insulin (199) Chlorpropamide (129) Glyburide (148) 5 Metformin (181) Mean Change (kg) Baseline = 85 kg -5 Naast het feit dat alle therapieen op de duur falen zien we ook Zoals reeds gezegd in UKPDS een ontwikkeling van gewichtstoename met alle therapieen (behalve metformin) die dan uiteindelijk ook zorgt voor een toename van de insulineresistentie 2 4 6 8 10 Time From Randomization (y) Adapted from UK Prospective Diabetes Study (UKPDS) Group. Lancet. 1998;352:
 Insulin (199) Chlorpropamide (129) Glyburide (148) 5. Metformin (181) Mean Change (kg) Baseline = 85 kg. -5. Naast het feit dat alle therapieen op de duur falen zien we ook. Zoals reeds gezegd in UKPDS een ontwikkeling van gewichtstoename met alle therapieen (behalve metformin) die dan uiteindelijk ook zorgt voor een toename van de insulineresistentie Time From Randomization (y) Adapted from UK Prospective Diabetes Study (UKPDS) Group. Lancet. 1998;352:")
49
Niet alleen Insuline maar ook glucagon speelt een rol bij de glucose homeostase
Glucagon (α cell) Fasting state Fed state Pancreas Insulin (β cell) Insulin and Glucagon Regulate Normal Glucose Homeostasis Normal glucose homeostasis is maintained in large part through a feedback relationship between insulin, glucagon, and circulating glucose.1 Fasting State In the fasting state, pancreatic alpha (α) cells release glucagon.1,2 Glucagon release is triggered by a fall in the plasma glucose level.1 Concomitantly, the pancreatic beta (β) cells secrete less insulin. Glucagon directs the liver to break down stored glycogen into glucose (glycogenolysis).1 The liver also generates new glucose (gluconeogenesis) during fasting. The end result is that the liver releases glucose into the bloodstream, thereby raising the plasma glucose level and maintaining homeostasis. Fed State In the fed state, meal-derived glucose enters the bloodstream, and the β cells detect the rise in glucose level and respond by promptly releasing insulin.1 Insulin signals other tissues in the body to take in glucose to be used as energy or stored for later use.1 Insulin also signals the liver to decrease glucose production, thus suppressing hepatic glucose production. The net result is the lowering of the plasma glucose level. In the fed state, release of glucagon is suppressed, which also contributes to a decrease in glucose production.1 Normal functioning of this feedback loop helps maintain glucose homeostasis. Glucose output Glucose uptake Purpose: To explain how normal physiology works in order to set the foundation for understanding the physiologic defects in type 2 diabetes. This slide demonstrates the key regulatory roles of insulin and glucagon on glucose homeostasis in both the fasting and fed states. Take-away: Glucose homeostasis under normal conditions is well regulated. Liver Blood glucose Muscle Adipose tissue Porte D Jr, Kahn SE. Clin Invest Med. 1995;18:247–254. Adapted with permission from Kahn CR, Saltiel AR. In: Kahn CR et al, eds. Joslin’s Diabetes Mellitus. 14th ed. Lippincott Williams & Wilkins; 2005:145–168. 4 References 1. Porte D Jr, Kahn SE. The key role of islet dysfunction in type II diabetes mellitus. Clin Invest Med ;18:247–254. 2. Unger RH. Glucagon and the insulin: glucagon ratio in diabetes and other catabolic illnesses. Diabetes ;20:834–838.
 Fasting state. Fed state. Pancreas. Insulin. (β cell) Insulin and Glucagon Regulate Normal Glucose Homeostasis. Normal glucose homeostasis is maintained in large part through a feedback relationship between insulin, glucagon, and circulating glucose.1. Fasting State. In the fasting state, pancreatic alpha (α) cells release glucagon.1,2 Glucagon release is triggered by a fall in the plasma glucose level.1 Concomitantly, the pancreatic beta (β) cells secrete less insulin. Glucagon directs the liver to break down stored glycogen into glucose (glycogenolysis).1 The liver also generates new glucose (gluconeogenesis) during fasting. The end result is that the liver releases glucose into the bloodstream, thereby raising the plasma glucose level and maintaining homeostasis. Fed State. In the fed state, meal-derived glucose enters the bloodstream, and the β cells detect the rise in glucose level and respond by promptly releasing insulin.1. Insulin signals other tissues in the body to take in glucose to be used as energy or stored for later use.1 Insulin also signals the liver to decrease glucose production, thus suppressing hepatic glucose production. The net result is the lowering of the plasma glucose level. In the fed state, release of glucagon is suppressed, which also contributes to a decrease in glucose production.1. Normal functioning of this feedback loop helps maintain glucose homeostasis. Glucose output. Glucose uptake. Purpose: To explain how normal physiology works in order to set the foundation for understanding the physiologic defects in type 2 diabetes. This slide demonstrates the key regulatory roles of insulin and glucagon on glucose homeostasis in both the fasting and fed states. Take-away: Glucose homeostasis under normal conditions is well regulated. Liver. Blood glucose. Muscle. Adipose tissue. Porte D Jr, Kahn SE. Clin Invest Med. 1995;18:247–254. Adapted with permission from Kahn CR, Saltiel AR. In: Kahn CR et al, eds. Joslin’s Diabetes Mellitus. 14th ed. Lippincott Williams & Wilkins; 2005:145– References. 1. Porte D Jr, Kahn SE. The key role of islet dysfunction in type II diabetes mellitus. Clin Invest Med. 1995;18:247– Unger RH. Glucagon and the insulin: glucagon ratio in diabetes and other catabolic illnesses. Diabetes. 1971;20:834–838.")
50
Wat loopt er mis bij diabetes type 2
Hepatic glucose output Insulin resistance Glucose uptake Glucagon (α cell) Insulin (β cell) Liver Hyperglycemia Islet-cell Dysfunction Muscle Adipose tissue Pancreas Major Pathophysiologic Defects in Type 2 Diabetes This diagram depicts the impact of type 2 diabetes on the feedback loop that regulates glucose homeostasis. In type 2 diabetes, insulin resistance is increased and insulin secretion is impaired.1 Most patients with type 2 diabetes have insulin resistance. Normally, pancreatic β cells increase insulin secretion to compensate for insulin resistance. However, when β-cell function is impaired, hyperglycemia develops.1 By the time diabetes is diagnosed, β-cell function has already decreased substantially and continues to decline over time.1 Once insulin secretion is impaired, an imbalance between insulin and glucagon can develop. Elevated glucagon levels lead to an increase in hepatic glucose production, which leads to an increase in blood glucose.1 Likewise, with decreased secretion of insulin, less glucose is taken up by muscle and adipose tissue.2 Purpose: To explain the 3 core defects of type 2 diabetes. Take-away: Insulin resistance, β-cell dysfunction, and elevated hepatic glucose production each contribute to hyperglycemia in type 2 diabetes. Adapted with permission from Kahn CR, Saltiel AR. In: Kahn CR et al, eds. Joslin’s Diabetes Mellitus. 14th ed. Lippincott Williams & Wilkins; 2005:145–168; Del Prato S, Marchetti P. Horm Metab Res. 2004;36:775–781; Porte D Jr, Kahn SE. Clin Invest Med. 1995;18:247–254. 5 References 1. Del Prato S, Marchetti P. Beta- and alpha-cell dysfunction in type 2 diabetes. Horm Metab Res. 2004;36:775–781. 2. Porte D Jr, Kahn SE. The key role of islet dysfunction in type 2 diabetes mellitus. Clin Invest Med. 1995;18:247–254.
 Insulin. (β cell) Liver. Hyperglycemia. Islet-cell Dysfunction. Muscle. Adipose tissue. Pancreas. Major Pathophysiologic Defects in Type 2 Diabetes. This diagram depicts the impact of type 2 diabetes on the feedback loop that regulates glucose homeostasis. In type 2 diabetes, insulin resistance is increased and insulin secretion is impaired.1. Most patients with type 2 diabetes have insulin resistance. Normally, pancreatic β cells increase insulin secretion to compensate for insulin resistance. However, when β-cell function is impaired, hyperglycemia develops.1. By the time diabetes is diagnosed, β-cell function has already decreased substantially and continues to decline over time.1. Once insulin secretion is impaired, an imbalance between insulin and glucagon can develop. Elevated glucagon levels lead to an increase in hepatic glucose production, which leads to an increase in blood glucose.1. Likewise, with decreased secretion of insulin, less glucose is taken up by muscle and adipose tissue.2. Purpose: To explain the 3 core defects of type 2 diabetes. Take-away: Insulin resistance, β-cell dysfunction, and elevated hepatic glucose production each contribute to hyperglycemia in type 2 diabetes. Adapted with permission from Kahn CR, Saltiel AR. In: Kahn CR et al, eds. Joslin’s Diabetes Mellitus. 14th ed. Lippincott Williams & Wilkins; 2005:145–168; Del Prato S, Marchetti P. Horm Metab Res. 2004;36:775–781; Porte D Jr, Kahn SE. Clin Invest Med. 1995;18:247– References. 1. Del Prato S, Marchetti P. Beta- and alpha-cell dysfunction in type 2 diabetes. Horm Metab Res. 2004;36:775– Porte D Jr, Kahn SE. The key role of islet dysfunction in type 2 diabetes mellitus. Clin Invest Med. 1995;18:247–254.")
51
Verloop van DM type 2 Progression of Disease Relative %
Verloop van DM type 2 Progression of Disease Insulin resistance 100 Hepatic glucose production Relative % 50 Insulin level β-cell function 4–7 years Postprandial glucose Development and Progression of Type 2 Diabetes This conceptual diagram shows a proposed paradigm on the development and progression of pathophysiology in type 2 diabetes. The horizontal axis in the figure shows the years prior to and after diagnosis of diabetes. Insulin resistance rises during disease development and continues to rise during impaired glucose tolerance (IGT). Over time, insulin resistance remains stable during the progression of type 2 diabetes.1 The insulin secretion rate increases, to compensate for the decrease in insulin effectiveness due to insulin resistance. This increase is often misperceived as an increase in β-cell function. Thus, β-cell function can decrease even as insulin secretion increases. Over time, β-cell compensatory function deteriorates and insulin secretion decreases. β-cell function progressively fails.1 Initially, fasting glucose is maintained in near-normal ranges. The pancreatic β cells compensate by increasing insulin levels, leading to hyperinsulinemia. This compensation keeps glucose levels normalized for a time, but as β cells begin to fail, IGT develops with mild postprandial hyperglycemia. As the disease progresses, the β cells continue to fail, resulting in higher postprandial glucose (PPG) levels. With further loss of insulin secretory capacity, fasting glucose and hepatic glucose production increase.1 Once β cells cannot secrete sufficient insulin to maintain normal glycemia at the fasting or postprandial stage, type 2 diabetes (hyperglycemia) becomes evident. Insulin resistance and β-cell dysfunction are established well before type 2 diabetes is diagnosed.2 Fasting glucose Purpose: To address the common misconception that an increase in insulin secretion (hyperinsulinemia) connotes an improvement in β-cell function. Take-away: Both insulin resistance and β-cell dysfunction start early–and well before diabetes is diagnosed–leading to rises in fasting and PPG levels. Impaired Glucose Tolerance Frank Diabetes Diabetes Diagnosis *Conceptual representation. Adapted with permission from Ramlo-Halsted et al. Prim Care. 1999;26:771–789. 6 References 1. Ramlo-Halsted BA, Edelman SV. The natural history of type 2 diabetes. Implications for clinical practice. Prim Care. 1999;26:771–789. 2. Kahn SE. The relative contributions of insulin resistance and beta-cell dysfunction to the pathophysiology of type 2 diabetes. Diabetologia. 2003;46:3–19.
. Over time, insulin resistance remains stable during the progression of type 2 diabetes.1. The insulin secretion rate increases, to compensate for the decrease in insulin effectiveness due to insulin resistance. This increase is often misperceived as an increase in β-cell function. Thus, β-cell function can decrease even as insulin secretion increases. Over time, β-cell compensatory function deteriorates and insulin secretion decreases. β-cell function progressively fails.1. Initially, fasting glucose is maintained in near-normal ranges. The pancreatic β cells compensate by increasing insulin levels, leading to hyperinsulinemia. This compensation keeps glucose levels normalized for a time, but as β cells begin to fail, IGT develops with mild postprandial hyperglycemia. As the disease progresses, the β cells continue to fail, resulting in higher postprandial glucose (PPG) levels. With further loss of insulin secretory capacity, fasting glucose and hepatic glucose production increase.1. Once β cells cannot secrete sufficient insulin to maintain normal glycemia at the fasting or postprandial stage, type 2 diabetes (hyperglycemia) becomes evident. Insulin resistance and β-cell dysfunction are established well before type 2 diabetes is diagnosed.2. Fasting glucose. Purpose: To address the common misconception that an increase in insulin secretion (hyperinsulinemia) connotes an improvement in β-cell function. Take-away: Both insulin resistance and β-cell dysfunction start early–and well before diabetes is diagnosed–leading to rises in fasting and PPG levels. Impaired Glucose Tolerance. Frank Diabetes. Diabetes Diagnosis. *Conceptual representation. Adapted with permission from Ramlo-Halsted et al. Prim Care. 1999;26:771– References. 1. Ramlo-Halsted BA, Edelman SV. The natural history of type 2 diabetes. Implications for clinical practice. Prim Care. 1999;26:771– Kahn SE. The relative contributions of insulin resistance and beta-cell dysfunction to the pathophysiology of type 2 diabetes. Diabetologia. 2003;46:3–19.")
52
Incretines Quoi ? Que ? Watte ?
Nieuwe therapie : Incretines Quoi ? Que ? Watte ?

53
INCRETINES Elrick H. Plasma insulin response to oral and intravenous glucose administration. J clin Invest 1964; 24 : , peroraal toegediende glucose zorgt voor hogere insuline spiegels dan IV toegediend glucose. Creutzfeldt W. New developments in the incretin concept today. Diabetologia 1985 ; 28 : aanwezigheid van enteroinsulaire as rol van incretines Dus is er vanuit de industrie een blijvende zoektoch naar alternatieve behandelingswijzen van diabetes We weten dat er zoiets bestaat als een enteroinsulaire as Want peroraal toegediend glucose zorgt vor hogere insulinespiegels dan IV toegediend glcuose

54
Incretine Effect : meer effect van peroraal glucose dan IV
Incretine Effect : meer effect van peroraal glucose dan IV Oral Glucose IV Glucose 11 2.0 * 1.5 Incretin Effect DISCUSSION The incretin effect is essentially the difference in -cell response between administration of oral glucose and intravenous (IV) glucose There is a sharp difference between the insulin response to oral glucose (as measured by C-peptide, a surrogate marker for insulin) compared with the insulin response to IV glucose. That difference, or effect, is the incretin effect, which is shown on the right graph by the shaded area. There is little difference between the venous plasma glucose profiles over time in response to oral glucose compared with the response to IV glucose BACKGROUND This was a crossover study involving healthy subjects Six young healthy subjects were given a 25, 50, or 100 g oral glucose load or isoglycaemic intravenous glucose infusions. The 50 g data is shown above. C-peptide may be a better measure of insulin secretion than plasma insulin, because C-peptide levels are not affected by hepatic insulin extraction This difference in C-peptide levels in response to oral vs intravenous glucose suggests that other factors (incretins), and not merely the direct actions of plasma glucose, affect the insulin secretory response 5.5 C-peptide (nmol/L) 1.0 Venous Plasma Glucose (mmol/L) 0.5 0.0 01 02 02 60 120 180 01 60 120 180 Time (min) Time (min) Mean ± SE; N = 6; *p.05; = glucose infusion time. Nauck MA, et al. Incretin effects of increasing glucose loads in man calculated from venous insulin and C-peptide responses. J Clin Endocrinol Metab. 1986;63: Copyright 1986, The Endocrine Society.
 glucose. There is a sharp difference between the insulin response to oral glucose (as measured by C-peptide, a surrogate marker for insulin) compared with the insulin response to IV glucose. That difference, or effect, is the incretin effect, which is shown on the right graph by the shaded area. There is little difference between the venous plasma glucose profiles over time in response to oral glucose compared with the response to IV glucose. BACKGROUND. This was a crossover study involving healthy subjects. Six young healthy subjects were given a 25, 50, or 100 g oral glucose load or isoglycaemic intravenous glucose infusions. The 50 g data is shown above. C-peptide may be a better measure of insulin secretion than plasma insulin, because C-peptide levels are not affected by hepatic insulin extraction. This difference in C-peptide levels in response to oral vs intravenous glucose suggests that other factors (incretins), and not merely the direct actions of plasma glucose, affect the insulin secretory response C-peptide (nmol/L) 1.0. Venous Plasma Glucose (mmol/L) Time (min) Time (min) Mean ± SE; N = 6; *p.05; = glucose infusion time. Nauck MA, et al. Incretin effects of increasing glucose loads in man calculated from venous insulin and C-peptide responses. J Clin Endocrinol Metab. 1986;63: Copyright 1986, The Endocrine Society.")
55
Incretines spelen een rol in de glucose homeostase
Pancreas Gut Nutrient signals ● Glucose Hormonal signals GLP-1 GIP Glucagon (GLP-1) Insulin (GLP-1,GIP) Neural signals cells cells GLP-1 = glucagon-like peptide-1; GIP = glucose insulinotropic polypeptide Adapted from Kieffer T. Endocrine Reviews. 1999;20:876–913. Drucker DJ. Diabetes Care. 2003;26:2929–2940. Nauck MA et al. Diabetologia. 1993;36:741–744. Adapted with permission from Creutzfeldt W. Diabetologia. 1979;16:75–85. Copyright © Springer-Verlag. 13
 Insulin. (GLP-1,GIP) Neural signals. cells. cells. GLP-1 = glucagon-like peptide-1; GIP = glucose insulinotropic polypeptide. Adapted from Kieffer T. Endocrine Reviews. 1999;20:876–913. Drucker DJ. Diabetes Care. 2003;26:2929–2940. Nauck MA et al. Diabetologia. 1993;36:741–744. Adapted with permission from Creutzfeldt W. Diabetologia. 1979;16:75–85. Copyright © 1979 Springer-Verlag. 13.")
56
Incretine Effect is gereduceerd bij patienten met type 2 diabetes
Incretine Effect is gereduceerd bij patienten met type 2 diabetes Intravenous Glucose Oral Glucose Control Subjects Patients With Type 2 Diabetes 80 80 60 60 DISCUSSION The incretin effect appears to be reduced in patients with type 2 diabetes The -cell secretory response to oral glucose ingestion, as measured by increases in plasma insulin, was reduced in patients with type 2 diabetes In contrast, the -cell secretory response to IV glucose, as measured by increases in plasma insulin, was increased in patients with type 2 diabetes during the 180-minute course of intravenous glucose infusion BACKGROUND This study measured insulin and C-peptide responses to a 50 g oral glucose load and an isoglycaemic intravenous infusion. Plasma insulin responses were studied in 14 patients with type 2 diabetes and 8 metabolically healthy control subjects Insulin (mU/L) 40 40 * * 20 20 30 60 90 120 150 180 30 60 90 120 150 180 Time (min) Time (min) *p≤.05 compared with respective value after oral load. Nauck MA, et al. Diabetologia. 1986;29: Reprinted with permission from Springer-Verlag © 1986.
 * * Time (min) Time (min) *p≤.05 compared with respective value after oral load. Nauck MA, et al. Diabetologia. 1986;29: Reprinted with permission from Springer-Verlag ©")
57
Welke incretines kennen we nu ?
GLP-1 GIP

58
Incretines reguleren glucose homeostase via effect op eilandcellen
Incretines reguleren glucose homeostase via effect op eilandcellen 1/Brubaker, p 2653, C1, ¶2, L1-6, C2, L3-7 2/Zander 2002, p 828, C2, ¶2, L10-14; p 829, C1, ¶2, L1-6, C2, L1, 10-12, 15-23 3/Ahrén, p 366, C2, ¶3, L1-3,8-9; p 370, C1, ¶2, L1-4 5/Buse, p 1441, C2, ¶2, L1-7, ¶3, L1-7 CMK Ingestion of food Glucose dependent Insulin from beta cells (GLP-1 and GIP) Beta cells Insulin increases peripheral glucose uptake GI tract Active GLP-1 and GIP Release of incretin gut hormones Pancreas 1/Brubaker, p 2653, C1, ¶2, L1-6, C2, L3-7 2/Zander 2002, p 828, C2, ¶2, L10-14; p 829, C1, ¶2, L1-6, C2,L1,10-12,15-23 3/Ahrén, p 366, C2, ¶3, L1-3,8-9; p 370, C1, ¶2, L1-4 4/Drucker 2002, p 535, C1, ¶1, L1-7 5/Buse, p 1441, C2, ¶2, L1-7, ¶3, L1-7 The presence of nutrients in the gastrointestinal tract rapidly stimulates the release of incretins: GLP-1 from L cells located primarily in the distal gut (ileum and colon), and GIP from K cells in the proximal gut (duodenum).1,2 Collectively, these incretins exert several beneficial actions, including stimulating the insulin response in pancreatic beta cells and reducing glucagon production from pancreatic alpha cells when glucose levels are elevated.3,4 Increased insulin levels improve glucose uptake by peripheral tissues; the combination of increased insulin and decreased glucagon reduces hepatic glucose output.5 Blood glucose control Glucagon from alpha cells (GLP-1) Glucose dependent Alpha cells Increased insulin and decreased glucagon reduce hepatic glucose output Adapted from Brubaker PL, Drucker DJ Endocrinology 2004;145:2653–2659; Zander M et al Lancet 2002;359:824–830; Ahrén B Curr Diab Rep 2003;3:365–372; Buse JB et al. In Williams Textbook of Endocrinology. 10th ed. Philadelphia, Saunders, 2003:1427–1483. References Brubaker PL, Drucker DJ. Minireview: Glucagon-like peptides regulate cell proliferation and apoptosis in the pancreas, gut, and central nervous system. Endocrinology 2004;145: 2653–2659. Zander M, Madsbad S, Madsen JL et al. Effect of 6-week course of glucagon-like peptide 1 on glycaemic control, insulin sensitivity, and β-cell function in type 2 diabetes: A parallel-group study. Lancet 2002;359:824–830. Ahrén B. Gut peptides and type 2 diabetes mellitus treatment. Curr Diab Rep 2003;3:365–372. Drucker DJ. Biological actions and therapeutic potential of the glucagon-like peptides. Gastroenterology 2002;122:531–544. Buse JB, Polonsky KS, Burant CF. Type 2 diabetes mellitus. In: Larsen PR, Kronenberg HM, Melmed S et al, eds. Williams Textbook of Endocrinology. 10th ed. Philadelphia: Saunders, 2003:1427–1483.
 Beta cells. Insulin increases peripheral glucose uptake. GI tract. Active GLP-1 and GIP. Release of incretin gut hormones. Pancreas. 1/Brubaker, p 2653, C1, ¶2, L1-6, C2, L3-7. 2/Zander 2002, p 828, C2, ¶2, L10-14; p 829, C1, ¶2, L1-6, C2,L1,10-12, /Ahrén, p 366, C2, ¶3, L1-3,8-9; p 370, C1, ¶2, L1-4. 4/Drucker 2002, p 535, C1, ¶1, L1-7. 5/Buse, p 1441, C2, ¶2, L1-7, ¶3, L1-7. The presence of nutrients in the gastrointestinal tract rapidly stimulates the release of incretins: GLP-1 from L cells located primarily in the distal gut (ileum and colon), and GIP from K cells in the proximal gut (duodenum).1,2. Collectively, these incretins exert several beneficial actions, including stimulating the insulin response in pancreatic beta cells and reducing glucagon production from pancreatic alpha cells when glucose levels are elevated.3,4 Increased insulin levels improve glucose uptake by peripheral tissues; the combination of increased insulin and decreased glucagon reduces hepatic glucose output.5. Blood glucose control. Glucagon. from alpha cells (GLP-1) Glucose dependent. Alpha cells. Increased insulin and decreased glucagon reduce hepatic glucose output. Adapted from Brubaker PL, Drucker DJ Endocrinology 2004;145:2653–2659; Zander M et al Lancet 2002;359:824–830; Ahrén B Curr Diab Rep 2003;3:365–372; Buse JB et al. In Williams Textbook of Endocrinology. 10th ed. Philadelphia, Saunders, 2003:1427–1483. References. Brubaker PL, Drucker DJ. Minireview: Glucagon-like peptides regulate cell proliferation and apoptosis in the pancreas, gut, and central nervous system. Endocrinology 2004;145: 2653–2659. Zander M, Madsbad S, Madsen JL et al. Effect of 6-week course of glucagon-like peptide 1 on glycaemic control, insulin sensitivity, and β-cell function in type 2 diabetes: A parallel-group study. Lancet 2002;359:824–830. Ahrén B. Gut peptides and type 2 diabetes mellitus treatment. Curr Diab Rep 2003;3:365–372. Drucker DJ. Biological actions and therapeutic potential of the glucagon-like peptides. Gastroenterology 2002;122:531–544. Buse JB, Polonsky KS, Burant CF. Type 2 diabetes mellitus. In: Larsen PR, Kronenberg HM, Melmed S et al, eds. Williams Textbook of Endocrinology. 10th ed. Philadelphia: Saunders, 2003:1427–1483.")
59
GLP-1 Levels gedaald bij DM2
Meal Test Study GLP-1 Levels gedaald bij DM2 1/Toft-Nielsen 2001A, p 3718, Table 1 (n’s); p 3720, Fig 3 20 NGT (n=33) Type 2 diabetes (n=54) * * 15 GLP-1 (pmol/L) 10 A clinical study investigated meal-stimulated GLP-1 and GIP (see slide 15) responses in patients with type 2 diabetes (n=54) treated with sulfonylurea, biguanide, or both, versus responses in matched subjects with NGT (n=33) and unmatched subjects with IGT (n=15). The study also included analysis of glucagon, insulin, C-peptide, and pancreatic polypeptide. After an overnight fast following three days without antidiabetic medication, subjects consumed a mixed meal (containing 2250 K) and underwent blood sampling before the start of treatment and periodically over the next four hours.1 The slide shows GLP-1 levels in patients with type 2 diabetes versus subjects with NGT. Postprandial GLP-1 concentrations were significantly decreased in patients with type 2 diabetes compared with control subjects with NGT (p<0.05).1 GLP-1 responses for the IGT group (not shown) were between those of NGT controls and patients with type 2 diabetes regardless of gender and body mass index (BMI) covariates. BMI and gender-corrected GLP-1 area under the curve (AUC) means were 2464 (type 2 diabetes mellitus), 2907 (IGT), and 3066 (NGT) pmol/L•240 min (p=NS for NGT vs. IGT group).1 1/Toft-Nielsen 2001A, p 3717, C2, ¶1, L1-8; p 3718, C1, ¶3, L1-6, Table 1 (n’s); p 3720, C2, ¶3, L1-2; p 3718, C1, ¶3, L9-10 1/Toft-Nielsen 2001A, p 3721, C2, ¶1, L1-11; p 3720, Fig 3 (p value); p 3721, C2, ¶1, L7-11; p 3720, C2, ¶1, L4-13 5 60 120 180 240 Time (minutes) *p<0.05, type 2 diabetes vs. NGT Meal started at time 0 and finished at 10–15 minutes. Adapted from Toft-Nielsen M-B et al J Clin Endocrinol Metab 2001;86:3717–3723. Reference Toft-Nielsen M-B, Damholt MB, Madsbad S et al. Determinants of the impaired secretion of glucagon-like peptide-1 in type 2 diabetic patients. J Clin Endocrinol Metab 2001;86:3717–3723.
; p 3720, Fig NGT (n=33) Type 2 diabetes (n=54) * * 15. GLP-1 (pmol/L) 10. A clinical study investigated meal-stimulated GLP-1 and GIP (see slide 15) responses in patients with type 2 diabetes (n=54) treated with sulfonylurea, biguanide, or both, versus responses in matched subjects with NGT (n=33) and unmatched subjects with IGT (n=15). The study also included analysis of glucagon, insulin, C-peptide, and pancreatic polypeptide. After an overnight fast following three days without antidiabetic medication, subjects consumed a mixed meal (containing 2250 K) and underwent blood sampling before the start of treatment and periodically over the next four hours.1. The slide shows GLP-1 levels in patients with type 2 diabetes versus subjects with NGT. Postprandial GLP-1 concentrations were significantly decreased in patients with type 2 diabetes compared with control subjects with NGT (p<0.05).1. GLP-1 responses for the IGT group (not shown) were between those of NGT controls and patients with type 2 diabetes regardless of gender and body mass index (BMI) covariates. BMI and gender-corrected GLP-1 area under the curve (AUC) means were 2464 (type 2 diabetes mellitus), 2907 (IGT), and 3066 (NGT) pmol/L•240 min (p=NS for NGT vs. IGT group).1. 1/Toft-Nielsen 2001A, p 3717, C2, ¶1, L1-8; p 3718, C1, ¶3, L1-6, Table 1 (n’s); p 3720, C2, ¶3, L1-2; p 3718, C1, ¶3, L /Toft-Nielsen 2001A, p 3721, C2, ¶1, L1-11; p 3720, Fig 3 (p value); p 3721, C2, ¶1, L7-11; p 3720, C2, ¶1, L Time (minutes) *p<0.05, type 2 diabetes vs. NGT. Meal started at time 0 and finished at 10–15 minutes. Adapted from Toft-Nielsen M-B et al J Clin Endocrinol Metab 2001;86:3717–3723. Reference. Toft-Nielsen M-B, Damholt MB, Madsbad S et al. Determinants of the impaired secretion of glucagon-like peptide-1 in type 2 diabetic patients. J Clin Endocrinol Metab 2001;86:3717–3723.")
60
GLP-1 and GIP Levels and Actions in Type 2 Diabetes
GLP-1 and GIP Levels and Actions in Type 2 Diabetes 1/Toft-Nielsen 2001A, p 3720, Fig 3 2/Nauck 1993A, p 305, Table II; p 306, C2, ¶1, L1-4, 8-10 p 3720, Fig 2, Bottom panel p 306, C2, ¶1, L4-7 Patients with type 2 diabetes mellitus Incretin levels Incretin actions GLP-1 (p<0.05 vs. NGT) Intact GIP Intact* (p=0.047 vs. NGT) This slide summarizes the actions and postprandial levels of GLP-1 and GIP from the trials presented. In patients with type 2 diabetes, postprandial GLP-1 levels were significantly decreased compared with levels in subjects with NGT (p<0.05), while the insulinotropic action of this synthetic human incretin hormone was not significantly different.1,2 Conversely, postprandial GIP levels were not significantly different in patients with type 2 diabetes mellitus versus individuals with NGT when corrected for BMI and gender; however, the insulinotropic action of supraphysiologic doses of synthetic human GIP was significantly diminished (p=0.047) in patients with type 2 diabetes mellitus versus individuals with NGT. The low rate of infusion resulted in similar insulin levels in both groups (p=0.14).1,2 1/Toft-Nielsen 2001A, p 3720, Fig 3 2/Nauck 1993A, p 305, Table II; p 306, C2, ¶1, L1-4,8-10 p 3720, Fig 2, Bottom panel C2, ¶1, L4-7 *When corrected for gender and BMI Adapted from Toft-Nielsen M-B et al J Clin Endocrinol Metab 2001;86:3717–3723; Nauck MA et al J Clin Invest 1993;91:301–307. References Toft-Nielsen M-B, Damholt MB, Madsbad S et al. Determinants of the impaired secretion of glucagon-like peptide-1 in type 2 diabetic patients. J Clin Endocrinol Metab 2001;86:3717–3723. Nauck MA, Heimesaat MM, Ørskov C et al. Preserved incretin activity of glucagon-like peptide 1 [7-36 amide] but not of synthetic human gastric inhibitory polypeptide in patients with type-2 diabetes mellitus. J Clin Invest 1993;91:301–307.
 Intact. GIP. Intact* (p=0.047 vs. NGT) This slide summarizes the actions and postprandial levels of GLP-1 and GIP from the trials presented. In patients with type 2 diabetes, postprandial GLP-1 levels were significantly decreased compared with levels in subjects with NGT (p<0.05), while the insulinotropic action of this synthetic human incretin hormone was not significantly different.1,2 Conversely, postprandial GIP levels were not significantly different in patients with type 2 diabetes mellitus versus individuals with NGT when corrected for BMI and gender; however, the insulinotropic action of supraphysiologic doses of synthetic human GIP was significantly diminished (p=0.047) in patients with type 2 diabetes mellitus versus individuals with NGT. The low rate of infusion resulted in similar insulin levels in both groups (p=0.14).1,2. 1/Toft-Nielsen 2001A, p 3720, Fig 3. 2/Nauck 1993A, p 305, Table II; p 306, C2, ¶1, L1-4,8-10. p 3720, Fig 2, Bottom panel. C2, ¶1, L4-7. *When corrected for gender and BMI. Adapted from Toft-Nielsen M-B et al J Clin Endocrinol Metab 2001;86:3717–3723; Nauck MA et al J Clin Invest 1993;91:301–307. References Toft-Nielsen M-B, Damholt MB, Madsbad S et al. Determinants of the impaired secretion of glucagon-like peptide-1 in type 2 diabetic patients. J Clin Endocrinol Metab 2001;86:3717–3723. Nauck MA, Heimesaat MM, Ørskov C et al. Preserved incretin activity of glucagon-like peptide 1 [7-36 amide] but not of synthetic human gastric inhibitory polypeptide in patients with type-2 diabetes mellitus. J Clin Invest 1993;91:301–307.")
61
..initieel experimenten met continue infusen
GLP-1 heeft meer therapeutisch potentieel dan GIP bij diabetes mellitus type 2 Allebei hebben ze wel effect na inname van voedsel Het incretine effect is verminderd bij DM2 GIP secretie is normaal maar actie verminderd GLP-1 secretie is verminderd maar actie identiek Dus medicatie dat GLP-1 secretie kan verhogen therapeutisch nuttig, ..initieel experimenten met continue infusen Drucker DJ. Diabetes Care. 2003;26:

62
Maar GLP-1 wordt onmiddellijk afgebroken …
Maar GLP-1 wordt onmiddellijk afgebroken … Vlugge inactivation (DPP-4), Kort halfleven (~1-2 min) Dus noodzaak om continue infusen te geven DISCUSSION Despite its favourable biological actions, the therapeutic potential of glucagon-like peptide 1 (GLP-1) is limited primarily by its rapid degradation by the ubiquitous enzyme dipeptidyl peptidase-4 (DPP-4) Due to the GLP-1 short half-life of less than two minutes, continuous administration would be required to sustain plasma concentrations long enough to produce a therapeutic effect As is typical of other peptides, GLP-1 requires administration by injection Therapeutisch nut ? Drucker DJ, et al. Diabetes Care. 2003;26:
, Kort halfleven (~1-2 min) Dus noodzaak om continue infusen te geven. DISCUSSION. Despite its favourable biological actions, the therapeutic potential of glucagon-like peptide 1 (GLP-1) is limited primarily by its rapid degradation by the ubiquitous enzyme dipeptidyl peptidase-4 (DPP-4) Due to the GLP-1 short half-life of less than two minutes, continuous administration would be required to sustain plasma concentrations long enough to produce a therapeutic effect. As is typical of other peptides, GLP-1 requires administration by injection. Therapeutisch nut Drucker DJ, et al. Diabetes Care. 2003;26:")
63
Jaar 2008 zullen we om 2 redenen onthouden : REDEN 1a en 1 b:
Jaar 2008 zullen we om 2 redenen onthouden : REDEN 1a en 1 b: x 100 m met Olivia Borlée, Hanna Mariën, Élodie Ouédraogo, Kim Gevaert , en Tia Hellebaut

64
(Incretin mimetica (DPP-IV resistent)) DPP-IV inhibitoren
Oplossing (Incretin mimetica (DPP-IV resistent)) DPP-IV inhibitoren
) DPP-IV inhibitoren.")
65
Sitagliptin (JANUVIA)
Perorale vorm

66
Sitagliptin (DPP-IV inhibitor)
Toename GLP-1 maar in fysiologische dosis (niet suprafysiologisch) Zo : Vooral effect op glucagon Toename insulinesecretie Minder effect op eerste fase insulinesecretie In combinatie met biguanides nog additioneel effect (metformine GLP-1 secretogoog ?) Geen effect op maaglediging dus geen nausea
 Zo : Vooral effect op glucagon. Toename insulinesecretie. Minder effect op eerste fase insulinesecretie. In combinatie met biguanides nog additioneel effect (metformine GLP-1 secretogoog ) Geen effect op maaglediging dus geen nausea.")
67
Januvia Pilvorm 100 mg sitagliptine Dosering 1 per dag
Met of zonder voedsel Indien vergeten later op de dag innemen Geen dubbele dosis Nierinsufficientie : tot klaring 50 ml/min geen probleem Lever: licht tot matig niet aanpassen Ouderen : beperkte gegevens over 75 jaar Kinderen : niet onder 18 jaar

68
24-week Add-on Therapy to Metformin Study Daling in HbA1c en FPG
24-week Add-on Therapy to Metformin Study Daling in HbA1c en FPG R.1/Charbonnel, p2641-F.1B, Legend R.1/Charbonnel, p2641-F.1A, + Legend HbA1c FPG 6 12 18 24 8.0 8.5 9.0 9.5 10.0 10.5 Weeks FPG (mmol/L) Placebo (n=226) Sitagliptin 100 mg qd (n=454) R.1/Charbonnel, p2639-Col 3-Par.1-L1-2 p2640-Col 2-Par.1-L1-8 R.1/Charbonnel, p2640-Par.3-L1 HbA1c (% ± SE) The graph on the left shows that HbA1c decreased substantially over the first 12 weeks in the sitagliptin 100 mg group, and then remained stable—with a slight trend toward further reduction—over the remaining treatment period.1 At week 24, a significant reduction of HbA1c levels was achieved (–0.65% vs placebo, P<0.001).1 The graph on the right shows a progressive and statistically significant decrease in FPG* starting at week 6 and continuing throughout the study period (–1.4 mmol/L vs placebo, P<0.001).1 R.1/Charbonnel, p2641-F.1A R.1/Charbonnel, p2640-Col 2-Par.1-L1-14 Placebo (n=224) Sitagliptin 100 mg (n=453) R.1/Charbonnel, p2640-Col 2- Par.2-L1-2; Col 3- Par.Cont.-L1-15 SE = standard error All-patients-as-treated population LSM between-group differences at week 24 (95% CI): in HbA1C vs placebo = –0.65% [–0.77, –0.53] (P<0.001); in FPG vs placebo = –1.4 mmol/L [–1.7, –1.1] (P<0.001) To convert FPG from mmol/L to mg/dL divide by Copyright © 2006 American Diabetes Association. From Diabetes Care®, Vol. 29,2006; 2632–2637 Reprinted with permission from the American Diabetes Association. *To convert FPG from mmol/L to mg/dL divide by Reference: 1. Charbonnel B, Karasik A, Liu J, et al, for the Sitagliptin Study 020 Group. Efficacy and safety of the dipeptidyl peptidase-4 inhibitor sitagliptin added to ongoing metformin therapy in patients with type 2 diabetes inadequately controlled with metformin alone. Diabetes Care. 2006;29:2638–2643.
 Placebo (n=226) Sitagliptin 100 mg qd (n=454) R.1/Charbonnel, p2639-Col 3-Par.1-L1-2 p2640-Col 2-Par.1-L1-8. R.1/Charbonnel, p2640-Par.3-L1. HbA1c (% ± SE) The graph on the left shows that HbA1c decreased substantially over the first 12 weeks in the sitagliptin 100 mg group, and then remained stable—with a slight trend toward further reduction—over the remaining treatment period.1. At week 24, a significant reduction of HbA1c levels was achieved (–0.65% vs placebo, P<0.001).1. The graph on the right shows a progressive and statistically significant decrease in FPG* starting at week 6 and continuing throughout the study period (–1.4 mmol/L vs placebo, P<0.001).1. R.1/Charbonnel, p2641-F.1A. R.1/Charbonnel, p2640-Col 2-Par.1-L1-14. Placebo (n=224) Sitagliptin 100 mg (n=453) R.1/Charbonnel, p2640-Col 2- Par.2-L1-2; Col 3- Par.Cont.-L1-15. SE = standard error. All-patients-as-treated population. LSM between-group differences at week 24 (95% CI): in HbA1C vs placebo = –0.65% [–0.77, –0.53] (P<0.001); in FPG vs placebo = –1.4 mmol/L [–1.7, –1.1] (P<0.001) To convert FPG from mmol/L to mg/dL divide by Copyright © 2006 American Diabetes Association. From Diabetes Care®, Vol. 29,2006; 2632–2637 Reprinted with permission from the American Diabetes Association. *To convert FPG from mmol/L to mg/dL divide by Reference: 1. Charbonnel B, Karasik A, Liu J, et al, for the Sitagliptin Study 020 Group. Efficacy and safety of the dipeptidyl peptidase-4 inhibitor sitagliptin added to ongoing metformin therapy in patients with type 2 diabetes inadequately controlled with metformin alone. Diabetes Care. 2006;29:2638–2643.")
69
24-week Add-on Therapy to Metformin Study Gastrointestinale neveneffecten : geen statistische verschillen R.1/Charbonnel, p2642-T.2 Sitagliptin 100 mg (n=464) Placebo (n=237) n (%) Abdominal pain 10 (2.2) 9 (3.8) Diarrhea 12 (2.6) 6 (2.5) Nausea (1.3) 2 (0.8) Vomiting 5 (1.1) R.1/Charbonnel, p2639-Col 3-Par.Last-L1-5 There were no prespecified GI AEs (abdominal pain, diarrhea, nausea, vomiting) that showed statistically significant differences in incidence between the sitagliptin and placebo groups.1 Note: more patients were enrolled in the sitagliptin group than in the placebo group.1 R.1/Charbonnel, p2642-Par.Cont.- L1-6 R.1/Charbonnel, p2642-T.2 All-patients-as-treated population GI = gastrointestinal Adapted from Charbonnel et al. Diabetes Care. 2006;29:2638–2643. Reference: 1. Charbonnel B, Karasik A, Liu J, et al, for the Sitagliptin Study 020 Group. Efficacy and safety of the dipeptidyl peptidase-4 inhibitor sitagliptin added to ongoing metformin therapy in patients with type 2 diabetes inadequately controlled with metformin alone. Diabetes Care. 2006;29:2638–2643.
 Placebo (n=237) n. (%) Abdominal pain. 10. (2.2) 9. (3.8) Diarrhea. 12. (2.6) 6. (2.5) Nausea. (1.3) 2. (0.8) Vomiting. 5. (1.1) R.1/Charbonnel, p2639-Col 3-Par.Last-L1-5. There were no prespecified GI AEs (abdominal pain, diarrhea, nausea, vomiting) that showed statistically significant differences in incidence between the sitagliptin and placebo groups.1. Note: more patients were enrolled in the sitagliptin group than in the placebo group.1. R.1/Charbonnel, p2642-Par.Cont.- L1-6. R.1/Charbonnel, p2642-T.2. All-patients-as-treated population. GI = gastrointestinal. Adapted from Charbonnel et al. Diabetes Care. 2006;29:2638–2643. Reference: 1. Charbonnel B, Karasik A, Liu J, et al, for the Sitagliptin Study 020 Group. Efficacy and safety of the dipeptidyl peptidase-4 inhibitor sitagliptin added to ongoing metformin therapy in patients with type 2 diabetes inadequately controlled with metformin alone. Diabetes Care. 2006;29:2638–2643.")
70
24-week Add-on Therapy to Metformin Study evenveel hypo’s
24-week Add-on Therapy to Metformin Study evenveel hypo’s R.1/Charbonnel, p2642-T.2 R.1/Charbonnel, p2639-Col 3-Par. Last-L1-5 R.1/Charbonnel, p2642-T.2 The incidence of hypoglycemia was low and similar between treatment groups (1.3% and 2.1% in the sitagliptin plus metformin and placebo plus metformin groups, respectively).1 There was no statistically significant difference in incidence of hypoglycemia between the sitagliptin plus metformin and placebo plus metformin groups.1 R.1/Charbonnel, p2642-Col 1- Par.Cont.-L1-5 All-patients-as-treated population Adapted from Charbonnel et al. Diabetes Care. 2006;29:2638–2643. Reference: 1. Charbonnel B, Karasik A, Liu J, et al, for the Sitagliptin Study 020 Group. Efficacy and safety of the dipeptidyl peptidase-4 inhibitor sitagliptin added to ongoing metformin therapy in patients with type 2 diabetes inadequately controlled with metformin alone. Diabetes Care. 2006;29:2638–2643.
.1. There was no statistically significant difference in incidence of hypoglycemia between the sitagliptin plus metformin and placebo plus metformin groups.1. R.1/Charbonnel, p2642-Col 1- Par.Cont.-L1-5. All-patients-as-treated population. Adapted from Charbonnel et al. Diabetes Care. 2006;29:2638–2643. Reference: 1. Charbonnel B, Karasik A, Liu J, et al, for the Sitagliptin Study 020 Group. Efficacy and safety of the dipeptidyl peptidase-4 inhibitor sitagliptin added to ongoing metformin therapy in patients with type 2 diabetes inadequately controlled with metformin alone. Diabetes Care. 2006;29:2638–2643.")
71
52-week Sitagliptin vs Sulfonylurea Add-on Therapy to Metformin Study Gelijkaardige glycemische effecten 7.8 LS mean change from baseline (for both groups): –0.67% 7.6 7.4 R.1-p201-F.2A R1-p197-Col2- Par.Last-L1-L9 7.2 7.0 HbA1c (% ± SE) R.1-p197-Col 2 Par.Last- L1-L9 Sitagliptin 100 mg once daily with metformin was similar (noninferior) to sulfonylurea (glipizide) with metformin in lowering HbA1c, the primary efficacy endpoint of the study.1 At week 52, the least squares (LS) mean change from baseline in HbA1c was –0.67% in both groups in the per-protocol population.1 The graph shows that the reduction in HbA1c obtained with sitagliptin 100 mg once daily with metformin was sustained over the study period of 52 weeks. An estimate of durability from 24 to 52 weeks (coefficient of durability, [COD]) showed a lower COD for sitagliptin with metformin (0.008%/week) than for sulfonylurea (glipizide) with metformin (0.011%/week), indicating that durability was better for sitagliptin 100 mg once daily with metformin compared with sulfonylurea with metformin (COD difference between treatments was –0.003%).1 6.8 6.6 R.1-p197-Col2 Par.Last-L14-L18 Achieved primary hypothesis of noninferiority to sulfonylurea 6.4 6.2 R.1-p198-Par.Cont- L1-L7 Sulfonylureaa + metformin (n=411) 6.0 Sitagliptinb + metformin (n=382) 5.8 6 12 18 24 30 38 46 52 Weeks aSpecifically glipizide; bSitagliptin (100 mg/day) with metformin (≥1500 mg/day); Per-protocol population; LS = least squares Adapted from Nauck et al. Diabetes Obes Metab. 2007;9:194–205. Reference: 1. Nauck MA, Meininger G, Sheng D, et al, for the Sitagliptin Study 024 Group. Efficacy and safety of the dipeptidyl peptidase-4 inhibitor, sitagliptin, compared with the sulfonylurea, glipizide, in patients with type 2 diabetes inadequately controlled on metformin alone: a randomized, double-blind, non-inferiority trial. Diabetes Obes Metab. 2007;9:194–205.
: –0.67% R.1-p201-F.2A. R1-p197-Col2- Par.Last-L1-L HbA1c (% ± SE) R.1-p197-Col 2 Par.Last- L1-L9. Sitagliptin 100 mg once daily with metformin was similar (noninferior) to sulfonylurea (glipizide) with metformin in lowering HbA1c, the primary efficacy endpoint of the study.1 At week 52, the least squares (LS) mean change from baseline in HbA1c was –0.67% in both groups in the per-protocol population.1. The graph shows that the reduction in HbA1c obtained with sitagliptin 100 mg once daily with metformin was sustained over the study period of 52 weeks. An estimate of durability from 24 to 52 weeks (coefficient of durability, [COD]) showed a lower COD for sitagliptin with metformin (0.008%/week) than for sulfonylurea (glipizide) with metformin (0.011%/week), indicating that durability was better for sitagliptin 100 mg once daily with metformin compared with sulfonylurea with metformin (COD difference between treatments was –0.003%) R.1-p197-Col2. Par.Last-L14-L18. Achieved primary hypothesis of noninferiority to sulfonylurea R.1-p198-Par.Cont- L1-L7. Sulfonylureaa + metformin (n=411) 6.0. Sitagliptinb + metformin (n=382) Weeks. aSpecifically glipizide; bSitagliptin (100 mg/day) with metformin (≥1500 mg/day); Per-protocol population; LS = least squares. Adapted from Nauck et al. Diabetes Obes Metab. 2007;9:194–205. Reference: 1. Nauck MA, Meininger G, Sheng D, et al, for the Sitagliptin Study 024 Group. Efficacy and safety of the dipeptidyl peptidase-4 inhibitor, sitagliptin, compared with the sulfonylurea, glipizide, in patients with type 2 diabetes inadequately controlled on metformin alone: a randomized, double-blind, non-inferiority trial. Diabetes Obes Metab. 2007;9:194–205.")
72
Patients at HbA1c goal (%)
52-week Sitagliptin vs Sulfonylurea* Add-on Therapy to Metformin Study : meer patienten bereiken goal met sitagliptin HbA1c<7% at week 52 R.1/Nauck, p198-Par.1-L1 R.1/Nauck, p200-T.2-L2,3 Patients at HbA1c goal (%) R.1/Nauck, p198-Par.1-L1 At week 52, a substantial proportion (63%) of patients achieved the goal of HbA1c <7% when treated with sitagliptin (100 mg/day) with metformin (≥1500 mg/day). The percentage of patients achieving HbA1c <7% in the sitagliptin (100 mg/day) with metformin (≥1500 mg/day) group was similar to that observed in the sulfonylurea (glipizide) with metformin group (59%).1 n=240 n=242 *Specifically glipizide Per-protocol population Mean baseline HbA1c levels: sitagliptin 100 mg, 7.48%; glipizide, 7.52% Adapted from Nauck et al. Diabetes Obes Metab. 2007;9:194–205. Reference: 1. Nauck MA, Meininger G, Sheng D, et al, for the Sitagliptin Study 024 Group. Efficacy and safety of the dipeptidyl peptidase-4 inhibitor, sitagliptin, compared with the sulfonylurea, glipizide, in patients with type 2 diabetes inadequately controlled on metformin alone: A randomized, double-blind, non-inferiority trial. Diabetes Obes Metab. 2007;9:194–205.
 R.1/Nauck, p198-Par.1-L1. At week 52, a substantial proportion (63%) of patients achieved the goal of HbA1c <7% when treated with sitagliptin (100 mg/day) with metformin (≥1500 mg/day). The percentage of patients achieving HbA1c <7% in the sitagliptin (100 mg/day) with metformin (≥1500 mg/day) group was similar to that observed in the sulfonylurea (glipizide) with metformin group (59%).1. n=240. n=242. *Specifically glipizide. Per-protocol population. Mean baseline HbA1c levels: sitagliptin 100 mg, 7.48%; glipizide, 7.52% Adapted from Nauck et al. Diabetes Obes Metab. 2007;9:194–205. Reference: 1. Nauck MA, Meininger G, Sheng D, et al, for the Sitagliptin Study 024 Group. Efficacy and safety of the dipeptidyl peptidase-4 inhibitor, sitagliptin, compared with the sulfonylurea, glipizide, in patients with type 2 diabetes inadequately controlled on metformin alone: A randomized, double-blind, non-inferiority trial. Diabetes Obes Metab. 2007;9:194–205.")
73
LS mean change in body weight over timeb
52-week Sitagliptin vs Sulfonylureaa Add-on Therapy to Metformin Study Sitagliptin : minder hypo’s en gewichtsverlies R.1/Nauck, p202-F.4 R.1/Nauck, p200-Par.1-L1 p200-Par.2-L1 R.1/Nauck, p202-T.3 R.1/Nauck, p194-Results-L4 LS mean change in body weight over timeb Hypoglycemiab P<0.001 32% 5% 10 20 30 40 50 Week 52 Incidence (%) Sulfonylurea + metformin (n=416) Sitagliptin 100 mg/day + metformin (n=389) R.1/Nauck, p197-Par.2-L1 R.1/Nauck, p200-Par.2- L1-6 The graph on the left shows the change in body weight observed during the study period of 52 weeks with sitagliptin (100 mg/day) with metformin (≥1500 mg/day) and sulfonylurea* with metformin.1 Sitagliptin (100 mg/day) with metformin (≥1500 mg/day) induced a significant decrease in body weight that was maintained through week 52 of the study (–1.5 kg), whereas sulfonylurea with metformin induced a significant increase in body weight compared with baseline values (1.1 kg).1 The difference in body weight between the sitagliptin (100 mg/day) with metformin (≥1500 mg/day) and the sulfonylurea with metformin treatment groups was significant (–2.5 kg, P<0.001).1 The graph on the right shows that sitagliptin (100 mg/day) with metformin (≥1500 mg/day) induced a significantly lower incidence of hypoglycemic episodes compared with sulfonylurea with metformin (5% vs 32%, respectively).1 The difference in hypoglycemia between the sitagliptin (100 mg/day) with metformin (≥1500 mg/day) and sulfonylurea with metformin treatment groups was significant (27%, P<0.001).1 *Specifically glipizide Body weight (kg ± SE) R.1/Nauck, p200-Par.2-L1 R.1/Nauck, p200-Par.2-L1 R.1/Nauck, p202-Par.Last- L1 R.1/Nauck, p200-Par.1-L1 Sulfonylurea + metformin (n=584) Sitagliptin 100 mg/day + metformin (n=588) R.1/Nauck, p194-Results-L4 aSpecifically glipizide; bAll-patients-as-treated population. LS = least squares; LSM between-group difference at week 52 (95% CI): in body weight = –2.5 kg [–3.1, –2.0] (P<0.001); LSM change from baseline at week 52: glipizide: +1.1 kg; sitagliptin: –1.5 kg (P<0.001) Adapted from Nauck et al. Diabetes Obes Metab. 2007;9:194–205. Reference: 1. Nauck MA, Meininger G, Sheng D, et al, for the Sitagliptin Study 024 Group. Efficacy and safety of the dipeptidyl peptidase-4 inhibitor, sitagliptin, compared with the sulfonylurea, glipizide, in patients with type 2 diabetes inadequately controlled on metformin alone: A randomized, double-blind, non-inferiority trial. Diabetes Obes Metab. 2007;9:194–205.
 Sulfonylurea + metformin (n=416) Sitagliptin 100 mg/day + metformin (n=389) R.1/Nauck, p197-Par.2-L1. R.1/Nauck, p200-Par.2- L1-6. The graph on the left shows the change in body weight observed during the study period of 52 weeks with sitagliptin (100 mg/day) with metformin (≥1500 mg/day) and sulfonylurea* with metformin.1. Sitagliptin (100 mg/day) with metformin (≥1500 mg/day) induced a significant decrease in body weight that was maintained through week 52 of the study (–1.5 kg), whereas sulfonylurea with metformin induced a significant increase in body weight compared with baseline values (1.1 kg).1 The difference in body weight between the sitagliptin (100 mg/day) with metformin (≥1500 mg/day) and the sulfonylurea with metformin treatment groups was significant (–2.5 kg, P<0.001).1. The graph on the right shows that sitagliptin (100 mg/day) with metformin (≥1500 mg/day) induced a significantly lower incidence of hypoglycemic episodes compared with sulfonylurea with metformin (5% vs 32%, respectively).1 The difference in hypoglycemia between the sitagliptin (100 mg/day) with metformin (≥1500 mg/day) and sulfonylurea with metformin treatment groups was significant (27%, P<0.001).1. *Specifically glipizide. Body weight (kg ± SE) R.1/Nauck, p200-Par.2-L1. R.1/Nauck, p200-Par.2-L1. R.1/Nauck, p202-Par.Last- L1. R.1/Nauck, p200-Par.1-L1. Sulfonylurea + metformin (n=584) Sitagliptin 100 mg/day + metformin (n=588) R.1/Nauck, p194-Results-L4. aSpecifically glipizide; bAll-patients-as-treated population. LS = least squares; LSM between-group difference at week 52 (95% CI): in body weight = –2.5 kg [–3.1, –2.0] (P<0.001); LSM change from baseline at week 52: glipizide: +1.1 kg; sitagliptin: –1.5 kg (P<0.001) Adapted from Nauck et al. Diabetes Obes Metab. 2007;9:194–205. Reference: 1. Nauck MA, Meininger G, Sheng D, et al, for the Sitagliptin Study 024 Group. Efficacy and safety of the dipeptidyl peptidase-4 inhibitor, sitagliptin, compared with the sulfonylurea, glipizide, in patients with type 2 diabetes inadequately controlled on metformin alone: A randomized, double-blind, non-inferiority trial. Diabetes Obes Metab. 2007;9:194–205.")
74
nieuwe therapie bij DM type 2 als add-on to metformine
Take Home Message !!!! R.1/WPC, p1-Par.3-L1 p9-Par.2-L1 p21-Par.2-L1 p23-Par.6-L1 Add on therapie naast Metformine bij DM type 2 Significante verbetering glycemiecontrole Verbetering beta cell functie Goed getolereerd Gewichtsneutraal Laag aantal hypo’s Praktisch : nieuwe therapie bij DM type 2 als add-on to metformine R.1/WPC, p4-Par.3-L1 p22-Par.2-L1 p14-Par.2-L10 pp16-17-Par.Cont-L2 p23-Par.2-L9 R.1/WPC, p14-Par.2-L1, T.1 p14-T.1 R.1/WPC, p13-Par.Last-L1 p12-Par. Last-L1 R.1/WPC, p4-Par.5-L1 p14-Par.2-L12 p22-Par.4-L1 p23-Par.2-L8 R.1/WPC, p1-Par.3-L1 p9-Par.2-L1 p21-Par.2-L1 p23-Par.6-L1 p13-Par.Last-L1 p14-Par.2-L1, T.1 p23-Par.2-L2 p4-Par.3-L1 p22-Par.2-L1 p4-Par.5-L1 p14-Par.2-L12 p22-Par.4-L1 p23-Par.2-L8 Based on a comprehensive program of phase III studies, oral administration of sitagliptin to patients with type 2 diabetes who were not adequately controlled: Significantly improved glycemic control when used as add-on therapy to metformin and pioglitazone1 Provided statistically and clinically significant reductions in several glycemic parameters (HbA1c, FPG, PPG)1 Was effective across a broad range of HbA1c levels; however, it caused greater reduction in HbA1c in patients with higher baseline HbA1c1 Led to improvements in indices of insulin secretion and beta-cell function1 Was generally well tolerated, with the overall incidence of side effects similar to that reported with placebo.1 In addition, discontinuation due to AEs was similar across groups.1 Sitagliptin does not promote body weight gain1 Resulted in a low incidence of hypoglycemia similar to that of placebo1 R.1/WPC, p12-Par.Last-L1 R.1/WPC, p22-side effects Par.1-L3-4 R.1/WPC, p14-Par.2-L10 pp16-17-Par.Cont-L2 p23-Par.2-L9 Reference: 1. Data on file, MSD___________________.
1. Was effective across a broad range of HbA1c levels; however, it caused greater reduction in HbA1c in patients with higher baseline HbA1c1. Led to improvements in indices of insulin secretion and beta-cell function1. Was generally well tolerated, with the overall incidence of side effects similar to that reported with placebo.1 In addition, discontinuation due to AEs was similar across groups.1 Sitagliptin does not promote body weight gain1. Resulted in a low incidence of hypoglycemia similar to that of placebo1. R.1/WPC, p12-Par.Last-L1. R.1/WPC, p22-side effects Par.1-L3-4. R.1/WPC, p14-Par.2-L10 pp16-17-Par.Cont-L2 p23-Par.2-L9. Reference: 1. Data on file, MSD___________________.")
75
Nieuwe speler Galvus : vildagliptine (novartis) : 50 mg 2 maal per dag
Reeds vaste associatie : Eucreas (50/850 en 50/1000)
")
77
Januvia Babes : in het begin de zachte aanpak….
1. ADD ON TO METFORMIN 2. BEGIN OF THE DISEASE 3. NO HYPO’s 4. NO WEIGHT GAIN 5. NO SIDE EFFECTS 6. ONCE DAILY

78
Byetta Girls : tijd voor harder materiaal
1. In place of Insulin when failing therapy on SUR/MET 2. Injection twice daily with SUR and MET 3. Less Hypo’s 4. Cave Stomach 5. WEIGHT LOSS

79
… Wat blijft het grote voordeel van insuline ???

80
Addendum : Belangrijke studies met een boodschap
1. ACCORD 2. ADVANCE 3. POST UKPDS

81
Glycemia Research Question:
In middle aged or older adults with type 2 DM at high risk for a CVD event because of existing CVD or additional CVD risk factors, does a therapeutic strategy that targets A1C <6.0% reduce the rate of CVD events more than a strategy that targets A1C 7.0% to 7.9%? Design: Multi-center, randomized, controlled, double 2x2 factorial trial – 3 questions: glycemia, BP, Lipids Glycemia Trial: Open Label Blinded Endpoint Assessment Sample size 10,251 Randomized to intensive vs standard glycemia management

82
Drug Class/Drug (% of participants) Intensive (N = 5128) Standard (N = 5123) Any Insulin (%)* 77 55 Bolus Insulin (%) 35 Metformin (%) 95 87 Secretagogue (%) 74 Thiazolidinedione (%) 92 58 Rosiglitazone (%) 91 Acarbose (%) 23 5 Exenatide/Sitagliptin (%) 18 Exenatide (%) 12 4
 35. Metformin (%) Secretagogue (%) 74. Thiazolidinedione (%) Rosiglitazone (%) 91. Acarbose (%) Exenatide/Sitagliptin (%) 18. Exenatide (%)")
83
Compared with the standard strategy, the intensive strategy had:
Lower A1C Targets (achieved median) <6% (6.4%) vs 7-7.9% (7.5%) Greater use of medications: More multiple oral meds More insulin More combination orals + insulin 70% vs 45% on 3-5 oral classes 77% vs 55% on insulin 62% vs 18% on 3-5 orals + insulin More consequences of therapy: Severe hypoglycemia Weight gain More SAEs 10.5% vs 3.5% w/ hypoglycemia event requiring medical assistance 28% vs 14% >10 kg gain 2.2% vs 1.6% w non-hypo SAE
 <6% (6.4%) vs 7-7.9% (7.5%) Greater use of medications: More multiple oral meds. More insulin. More combination orals + insulin. 70% vs 45% on 3-5 oral classes. 77% vs 55% on insulin. 62% vs 18% on 3-5 orals + insulin. More consequences of therapy: Severe hypoglycemia. Weight gain. More SAEs. 10.5% vs 3.5% w/ hypoglycemia event requiring medical assistance. 28% vs 14% >10 kg gain. 2.2% vs 1.6% w non-hypo SAE.")
84
Primary outcome (composite nonfatal MI, nonfatal stroke, CVD death)
intensive standard HR = 0.90 (95% CI = ) p = 0.16 Mortality intensive standard HR = 1.22 (95% CI = ) p = 0.04
 p = Mortality. intensive. standard. HR = (95% CI = ) p =")
85
ADVANCE trial Inclusion criteria Type 2 diabetes mellitus
Age 55 years or older Additional risk of vascular event Age ≥ 65 years History of major macrovascular disease History of major microvascular disease First diagnosis of diabetes >10 years prior to entry Other major risk factor Any level of blood pressure Any level of glucose control but no definite indication for long-term insulin

86
Resultaten HbA1c at end of fu Intensive Standard
6.0% to 6.5% 7.1% to 7.5% <6.0% 6.6% to 7.0% >7.5%

87
Resultaten ADVANCE Summary – effects on main efficacy outcomes
Intensive glucose control resulted in: 10% reduction in combined primary outcome 14% reduction in microvascular events 21% reduction in nephropathy No significant effects on macrovascular events No significant effects on all-cause or cardiovascular mortality Consistent treatment effects in patient subgroups

88
Original and late-follow-up relative risk reduction with sulfonylurea/insulin
End point 1997: Relative risk reduction (%) 1997: p 2007: Relative risk reduction (%) 2007: p Any diabetes- related end point 12 0.029 9 0.040 Microvascular disease 25 0.0099 24 0.001 MI 16 0.052 15 0.014 All-cause mortality 6 0.44 13 0.007 Holman RR et al. N Engl J Med 2008;available at:
 1997: p. 2007: Relative risk reduction (%) 2007: p. Any diabetes- related end point Microvascular disease MI All-cause mortality Holman RR et al. N Engl J Med 2008;available at:")
89
Let’s keep on doing the job together : Diabetes is en blijft teamwork

Verwante presentaties


 Quiz Night !>")


