Download de presentatie
De presentatie wordt gedownload. Even geduld aub

1
Kerncijfers Maart 2016

2
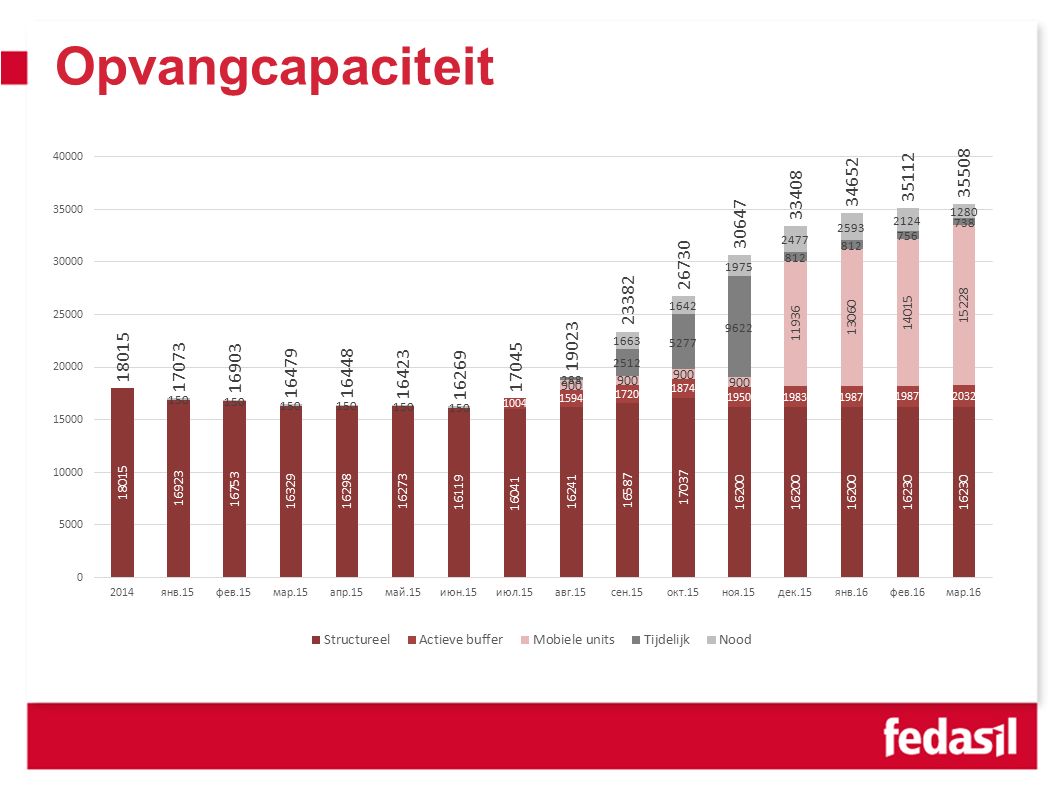
Opvangcapaciteit

4
Collectieve opvangcentra in België

5
Capaciteiten per partner

6
Bezetting opvangnetwerk

7
Bezettingsgraad

8
Instroom & uitstroom

9
In & Out sinds 2014

10
Instroom EU+

11
Instroom NBMV

12
Profiel bewoners

13
Instroom: herkomstlanden

14
Instroom: familiesamenstelling

15
Beschermingsgraad Erkend als vluchteling Subsidiaire bescherming Beschermingsgraad 201215,4%7,0%22,4% 201316,4%10,7%27,1% 201436,6%10,2%46,8% 201550,6%10,2%60,8% jan/1651,0%13,9%64,9% feb/1644,4%15,1%59,6%

16
Bedankt voor uw aandacht Vragen? www.fedasil.be

Verwante presentaties


 verblijf in open centra op asielzoekers. Door:De Jongh Sandra.>")


. Hiv tast het afweersysteem.>")


