Download de presentatie
De presentatie wordt gedownload. Even geduld aub

1
CrossLab Minor I sem 5 2011 Visualising Data: Data Design research kwartaal 1 120911 http://crosslabdataminor.wordpress.com/minor-visualizing-data-research-lesaanbod/

2
thema 1: data storytelling data as ‘beautiful evidence’ / ‘storytelling’

3
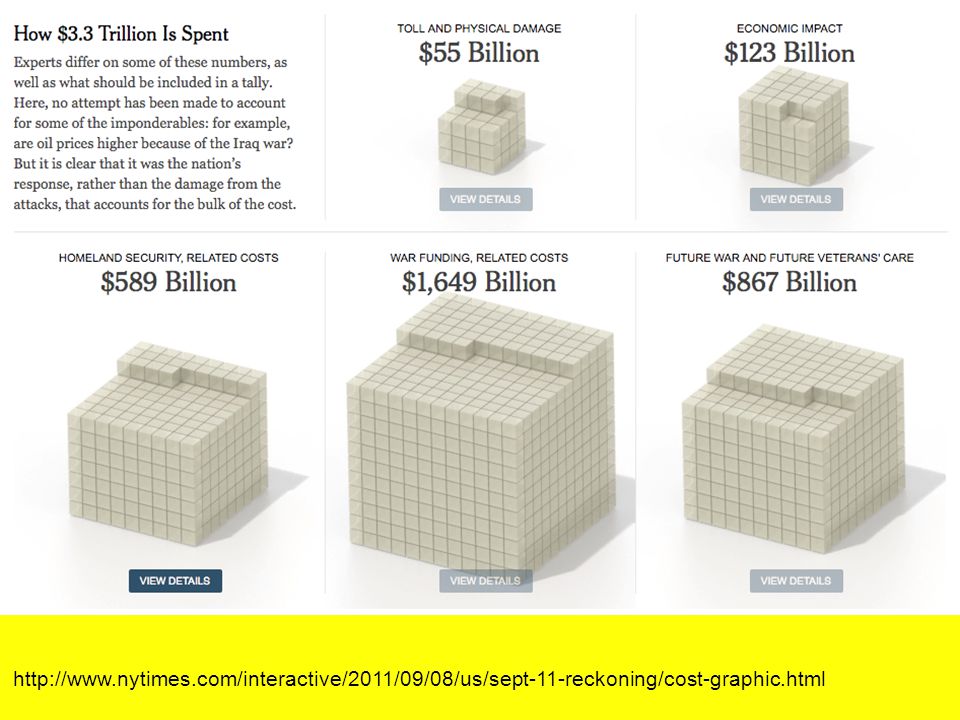
New York Times

4
http://www.nytimes.com/interactive/2011/09/08/us/sept-11-reckoning/cost-graphic.html
5
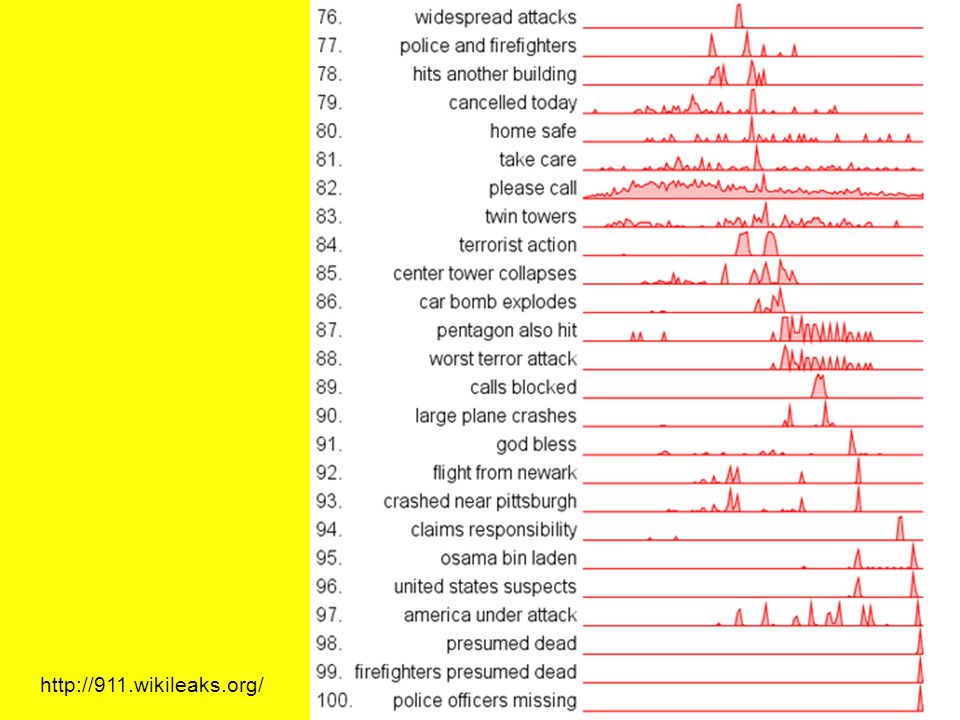
http://911.wikileaks.org/
6
actueel debat: Wat betekent de toenemende rol van allerlei verschillende databases in het dagelijkse leven voor onze samenleving? Wat voor kennis leveren al die verzamelde en verknoopte gegevens en analyses op? Lev Manovich http://followthemoney.nu/, 2010http://followthemoney.nu/

7
actueel debat: Doen we er wel altijd goed aan zo’n grote rol toe te dichten aan cijfermatige informatie? Lev Manovich http://followthemoney.nu/, 2010http://followthemoney.nu/

8
actueel debat: Schuilt er niet ook een gevaarlijke ontwikkelingin de opmars van databases, waarbij schijnbaar objectieve visualisaties en analyses opeens een belangrijke rol gaan spelen in het nemen van politieke beslissingen, de ontwikkeling van onze economie of de vorming van collectieve mythen? Lev Manovich http://followthemoney.nu/, 2010http://followthemoney.nu/

9
Hans Rosling, The Joy of Stats http://www.gapminder.org/

10
vorige week Datastorytelling: ‘beautiful evidence’ I bewijsmateriaal? - data design: simplicity? (Holmes, Tufte) - data as evidence: transparency? (Tufte) http://www.sourcemap.org/ - data as story: correlations? (Rosling)
 - data as evidence: transparency. (Tufte) - data as story: correlations. (Rosling).")
11
> lezen: Edward Tufte, The fundamental principles of Analytical Design (kopie) kern samenvatten > selecteer 3 datavisualisaties (deskresearch: zoekmethode?) Analyseer: hoe worden de principes van Case, Holmes, Rosling en Tufte hierbij ingezet? > publiceren op blog opdracht 120911

12
uitgangspunten data als storytelling correlations?

13
http://www.xach.com/moviecharts/2009.html correlations / story?

14
http://moebio.com/plasma / correlations / story?

15
data als storytelling: Datajournalism http://www.guardian.co.uk/data http://www.nrcnext.nl/blog/tag/datavisualisatie/

16
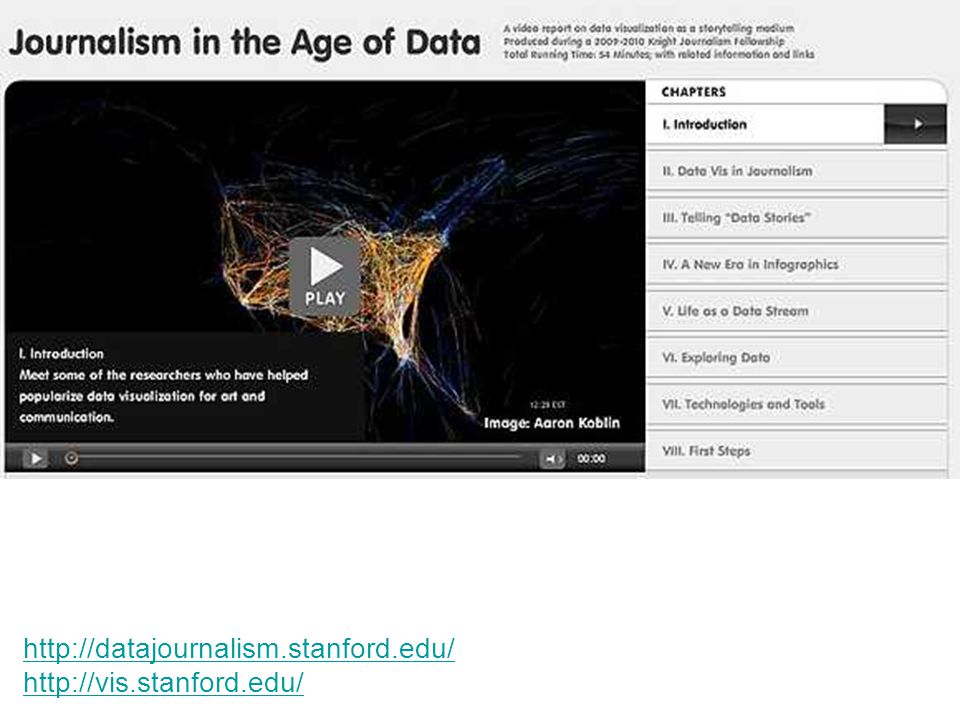
http://datajournalism.stanford.edu/ http://vis.stanford.edu/
17
datajournalism: data ‘beautiful evidence’ & storytelling van data naar story… - uitgangspunten: transparancy correlations / patronen + causaliteit + (non) lineariteit (‘handhelding’) - auteurschap: wie is de auteur van de datavisualisatie? - context: voor welk doel / publiek gemaakt? - manipulatie: invloed op de publieke opinie?

18
datavisualisatie + storytelling: Wat / Hoe / Wie / Voor wie?

19
Wat: data as beautiful evidence / story datasets… I love alaska, http://www.lernert.nl/index.php?/projects/i-love-alaska/

20
Wat: data as beautiful evidence / story datasets… http://www.catalogtree.net/projects/TouchDoc

21
Hoe: datavisualisatie als story vergelijkingen

22
hoe: datavisualisatie als story vergelijkingen http://www.nytimes.com/interactive/2008/10/06/opinion/06opchart.html

23
hoe: datavisualisatie als story tijd: timeline

24
hoe: datavisualisatie als story tijd: timeline http://projects.nytimes.com/crime/homicides/map

25
wie / voor wie: users als auteur crime mapping vs crime spotting http://oakland.crimespotting.org/

26
opdr. 190911 lezen: What Storytelling Can Do forInformation Visualization http://www.cparity.com/projects/AcmClassification/samples/381653.pdf /

Verwante presentaties


![Deltion College Engels C1 Gesprekken voeren [Edu/002]/ subvaardigheid lezen thema: Order, order…. can-do : kan een bijeenkomst voorzitten © Anne Beeker.](/8/2048322/big_thumb.jpg "Deltion College Engels C1 Gesprekken voeren [Edu/002]/ subvaardigheid lezen thema: Order, order…. can-do : kan een bijeenkomst voorzitten © Anne Beeker.>")


