Download de presentatie
De presentatie wordt gedownload. Even geduld aub

1
Planten als groene motor Slimme energie uit natuurlijke bron Westergozone: energie(k) aan de slag, Franeker 18 september 2009 Prof. Dr. J.P.M. (Johan) Sanders Valorisation of Plant Production Chains Wageningen University and Research center
 Sanders Valorisation of Plant Production Chains Wageningen University and Research center.")
2
The New Biomass value chain: € € € Food Biomass production 1st Agro logisticsFood pretreatmentFood productionFoodconversion Existing non- food: Feed Paper Additives Fibres Waste management. Biomass sources Agro-food production By products & waste Logistics&storage NL production Imports Existing conversion Existing production Biobased Products Biobased materials Bio-based chemicals Bio-fuels Bio-energy New production Performance materials Base&platform chemicals Performance chemicals Bio Energy New Pre-treatment & conversion

3
Platform Renewable Materials 30% substitution of fossil by Biomass in 2030 25% chemical resources (140 PJ) 60% transportation fuels (324 PJ) 17% heat (65 PJ) 20% electricity (203 PJ) By: Enhancing efficiency present Biomass (400 PJ) Development (new) crops (250 PJ) Aquatic cultures (250 PJ) Import (250 PJ)
 60% transportation fuels (324 PJ) 17% heat (65 PJ) 20% electricity (203 PJ) By: Enhancing efficiency present Biomass (400 PJ) Development (new) crops (250 PJ) Aquatic cultures (250 PJ) Import (250 PJ)")
4
Many drivers for the Biobased Economy Shortage of cheap oil High energy prices Security of energy supply Climate change by green house gasses Rural development Developing countries Geo-political conditions Different countries/groups are confident however that a BbE can contribute to their goals.

5
30 20 10 30 10 7 3 Production costs (€/GJ endproduct) heatelectricitytransport fuel average bulkchemical otherbiomass 2 G€ 5 G€ 6 G€ beet grass wood 6 G€ 15 G€ overall Dutch industry cost price overall Dutch industry raw material cost coal oil capital 4 23 12 75 How biomass can best compete with fossil derived products
 heatelectricitytransport fuel average bulkchemical otherbiomass 2 G€ 5 G€ 6 G€ beet grass wood 6 G€ 15 G€ overall Dutch industry cost price overall Dutch industry raw material cost coal oil capital How biomass can best compete with fossil derived products")
6
Bioraffinage

7
Biomass can bring different contributions to the farmer (€/ha) Assuming a yield of 10 tonnes dry weight per hectare, being 160 GJ, using whole crop and GAP up to 20 tonnes whole crop yield, 320 GJ/ha : 640 --- : 1360 --- : 6400 --- : 1800 – 3600 : 2080 - 4160 All Energy at coal value All transportfuel All bulkchemical 20% bulkchemical, 80% Energy 20% bulkchemical, 40% fuel, 40% Energy €/hectare On raw materials substitution only Including capital cost substitution 20% bulkchemical, 40% fuel, 40% Energy : 3000 - 6000
 Assuming a yield of 10 tonnes dry weight per hectare, being 160 GJ, using whole crop and GAP up to 20 tonnes whole crop yield, 320 GJ/ha : : : : 1800 – 3600 : All Energy at coal value All transportfuel All bulkchemical 20% bulkchemical, 80% Energy 20% bulkchemical, 40% fuel, 40% Energy €/hectare On raw materials substitution only Including capital cost substitution 20% bulkchemical, 40% fuel, 40% Energy :")
8
Forward integration reduces tranport cost and seasonality and will give more income to the farmer Fields Processing Present 100% Return flow 10% Farm Concept Small scale processing 100% Return flow 70% 30% concentrationfermentation

9
Hoe kun je op kleine schaal goedkoper zijn dan op grote schaal? Vermijd processtappen met warmte overdracht (alternatief, of overbodig maken! Of vanuit vele kleintjes één centrale verwerking) Reductie van kosten: Logistiek aanvoer en afvoer Grondstofkosten; bioraffinage en combi met veevoeder Recycle kosten (mineralen, bodemstructuur) Waterkosten Milieu investeringen (bovendien: platteland minder streng) Investeringskosten (bovendien: jaarrond productie en ‘aanleunen’ tegen bestaande infrastructuur en platteland minder streng) Restproduct opwaardering Biomassa → biogas Warmte CO2
 Reductie van kosten: Logistiek aanvoer en afvoer Grondstofkosten; bioraffinage en combi met veevoeder Recycle kosten (mineralen, bodemstructuur) Waterkosten Milieu investeringen (bovendien: platteland minder streng) Investeringskosten (bovendien: jaarrond productie en ‘aanleunen’ tegen bestaande infrastructuur en platteland minder streng) Restproduct opwaardering Biomassa → biogas Warmte CO2.")
10
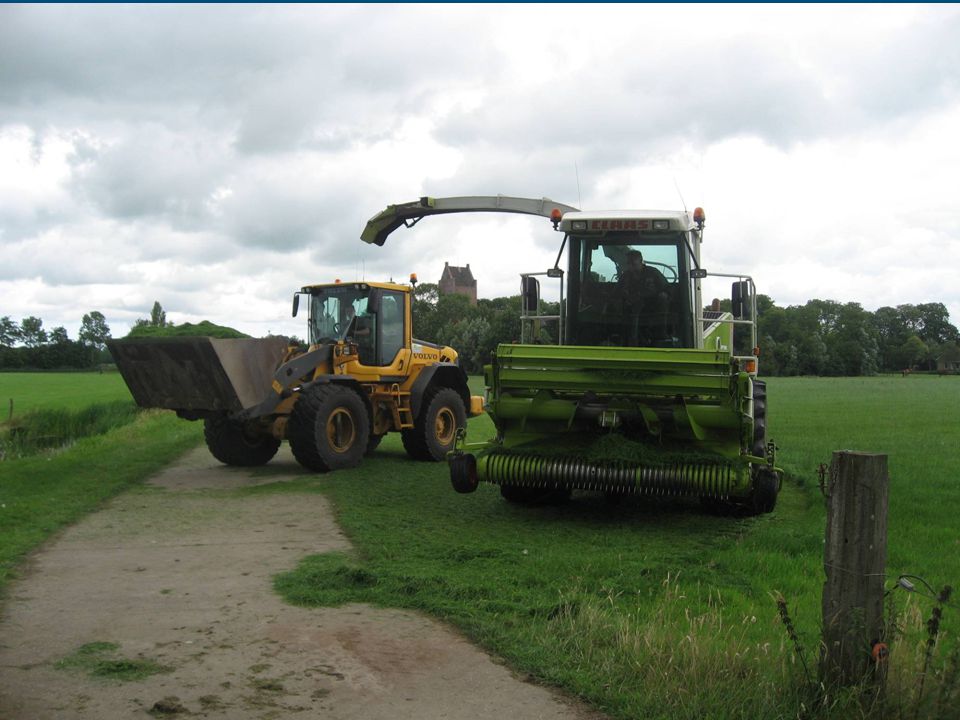
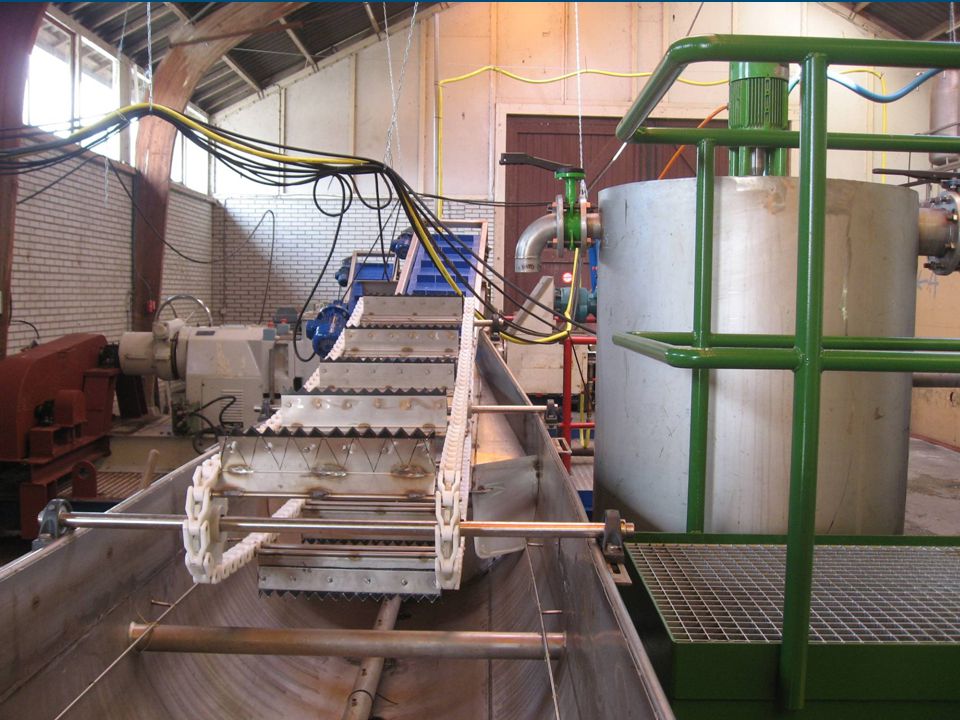
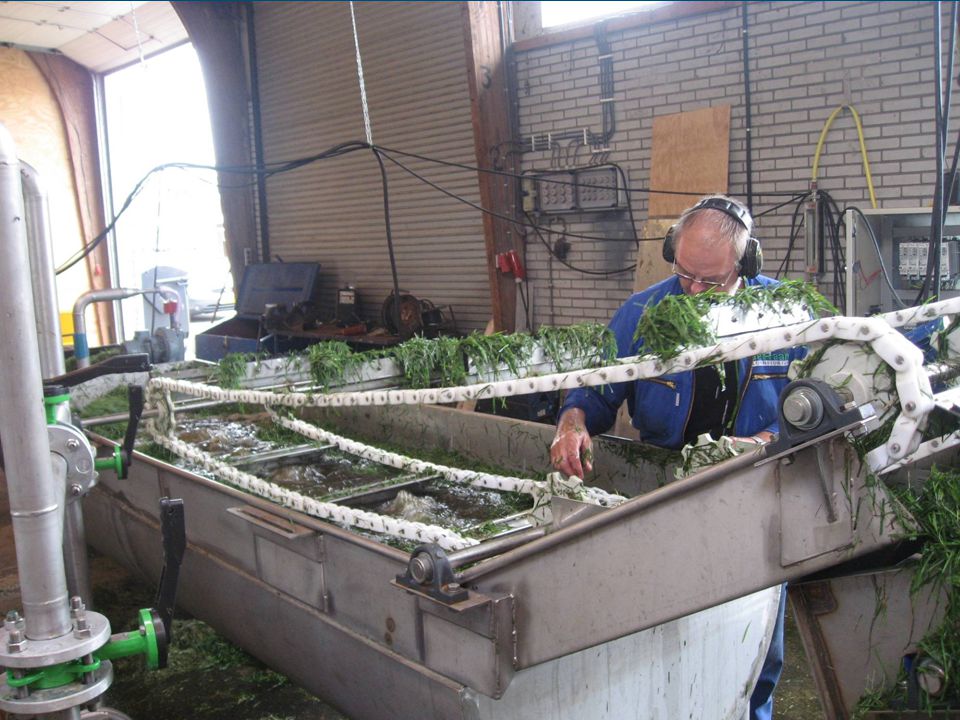
Pilot biorefinery line Foxhol (Groningen) (Prograss Consortium), nu Grassa (Oenkerk) Green grass proteincompound feed white grass protein Grass protein (products) +..... compound feed Grass juice concentrate Ethanol HTU- Biofuel Construction material + paper Polymer extrusion products Grass juice Protein Fibers

11
Warmte pm Elektriciteit200 kWh à 0.25€50 Transport/bewaren10 Arbeid3*2fte à 50.000/3200010 Gras kost60 €/ton ds50 – 80 Procesca. 50 €/ton ds50 KOSTEN(€)170 - 210
")
12
5 producten (natte) vezel 300 kg x 90 – 200 =27 – 60 Droog eiwit 200 kg x 300-50060 – 100 x 50 kg(vet x 300 =15 – 15 Melkzuur 150 kg x 500 – 800 =75 -120 Elektriciteit 50 kg x 15 x 3 =2.5 – 2.5 Reststroom K: 50 x 500 =5 - 25 P: 50 x 1000 =50 – 50 water: x 0 Inkomsten (€/ton ds)255 – 365 Marge(€/ton gras)80 – 145 2e generatie producten ………
 vezel 300 kg x 90 – 200 =27 – 60 Droog eiwit 200 kg x – 100 x 50 kg(vet x 300 =15 – 15 Melkzuur 150 kg x 500 – 800 = Elektriciteit 50 kg x 15 x 3 =2.5 – 2.5 Reststroom K: 50 x 500 = P: 50 x 1000 =50 – 50 water: x 0 Inkomsten (€/ton ds)255 – 365 Marge(€/ton gras)80 – 145 2e generatie producten ………")
16
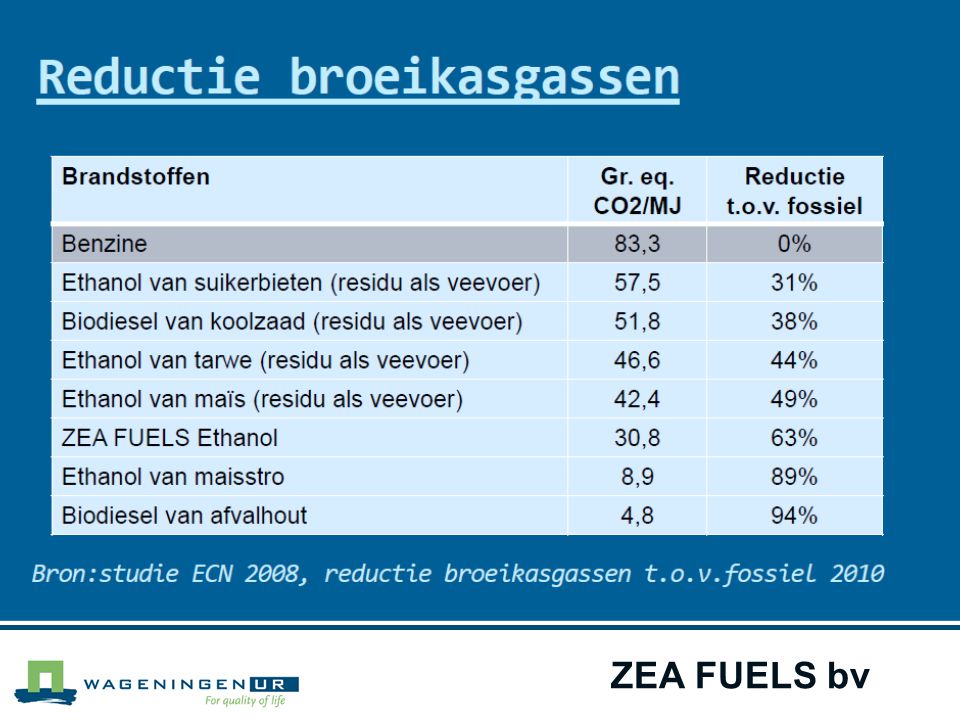
Zeafuels biogas heat Less investment costs/liter ethanol than large scale US ethanol production from corn Electricity /minerals Stem Corn Grain Stem Corn Grain 60% ethanol 60% ethanol Biogas fermentation Biogas fermentation CHP Ethanol fermentation Ethanol fermentation Distillation Biogas Filtration Zein

17
ZEA FUELS bv

19
Conclusies BBE heeft forse potenties en volgt geheel nieuwe paradigma’s: Er is geen landbouw overschot en energie is schaars. Bio-energie en BBE zijn onlosmakelijk verbonden. Functionaliteit van de biomassa levert wel veel meer waarde dan calorieën. Het gaat niet om food OR fuel maar om een goed onderbouwde food AND fuel met veel nieuwe kansen voor de (primaire) agrosector
 agrosector.")
20
Questions? © Wageningen UR

Verwante presentaties


![Deltion College Engels C1 Gesprekken voeren [Edu/002]/ subvaardigheid lezen thema: Order, order…. can-do : kan een bijeenkomst voorzitten © Anne Beeker.](/8/2048322/big_thumb.jpg "Deltion College Engels C1 Gesprekken voeren [Edu/002]/ subvaardigheid lezen thema: Order, order…. can-do : kan een bijeenkomst voorzitten © Anne Beeker.>")


