Download de presentatie
De presentatie wordt gedownload. Even geduld aub

1
Tot nu toe

2
Geschiedenis

3
Uitzonderingen, verschil in incidenties

4
Onderzoekstypen

5
There is no such thing as hierarchy

6
Wat is de vraag?

7
Diagnostisch onderzoek

8
Sensitiviteit Specificiteit LR

9
Post-test odds = pre-test odds x LR

11
Post-test odds = pre-test odds x LR sensitiviteit en specificiteit zijn contextafhankelijk!

12
Meerdegraads functie Y = a + b.1 + c.2 + d.3 + e.4 Y = a + b.1 + c.2 + d.3 + e.4

13
Bayes Bayes A study is just like a test! Variant of Bayes’s criterion: ‘truth’ of study outcome = outcome x plausibility

14
Type of study + accopanying bias Plausibility of hypothesis Chance that significant result is true Large randomised clinical trial (RCT) High85% Meta-analysis of large, unequivocal RCTs Very high85% Meta-analysis of smaller, contradictory trials Average41% Small, but well-designed RCT Average23% Small epidemiological ‘explorative’ study low12% Ioannidis, PLoS Medicine 2005; 2: 696-701
 High85% Meta-analysis of large, unequivocal RCTs Very high85% Meta-analysis of smaller, contradictory trials Average41% Small, but well-designed RCT Average23% Small epidemiological ‘explorative’ study low12% Ioannidis, PLoS Medicine 2005; 2:")
15
En verder?

16
Bias Chance Typen data Verdelingen SD vs SE Odds Sens, Spec LR } } } Hoofdstuk 1 Hoofdstuk 2 Hoofdstuk 3

17
Diastolische bloeddruk echt:80 mmHg gemeten: 98 mmHg

18
Systematische fout: bias Toevallige fout:chance, random variatie

19
Systematische fout: bias Toevallige fout:chance, random variatie epidemiologie statistiek

21
Bias Chance Typen data Verdelingen SD vs SE Odds Sens, Spec LR } } } Hoofdstuk 1 Hoofdstuk 2 Hoofdstuk 3

22
Typen bias

23
Selectiebias Informatiebias Confounding bias

24
Selectiebias Informatiebias Confounding bias

25
De kans in een onderzoekspopulatie opgenomen te worden is afhankelijk van de 1/ ziekte-uitkomst (cohort) 2/ determinant (patientcontrole)
 2/ determinant (patientcontrole)")
26
Van belang bij voorstadia ziektes

27
* Referral bias * Non-respondent bias

28
* informatiebias

29
* informatiebias (measurement bias)
")
30
* recall bias

31
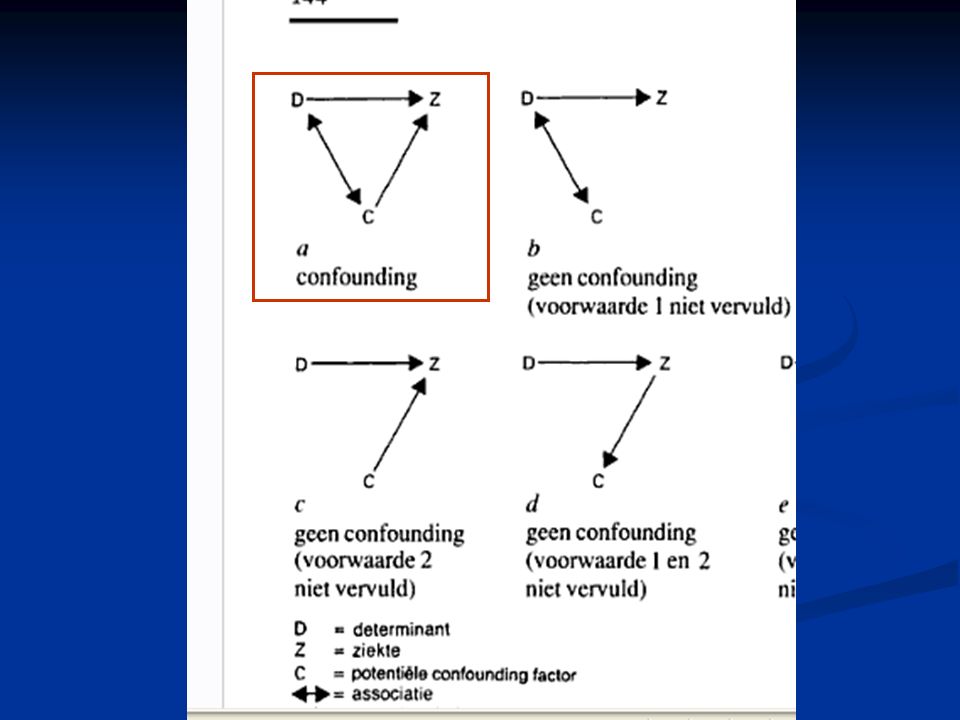
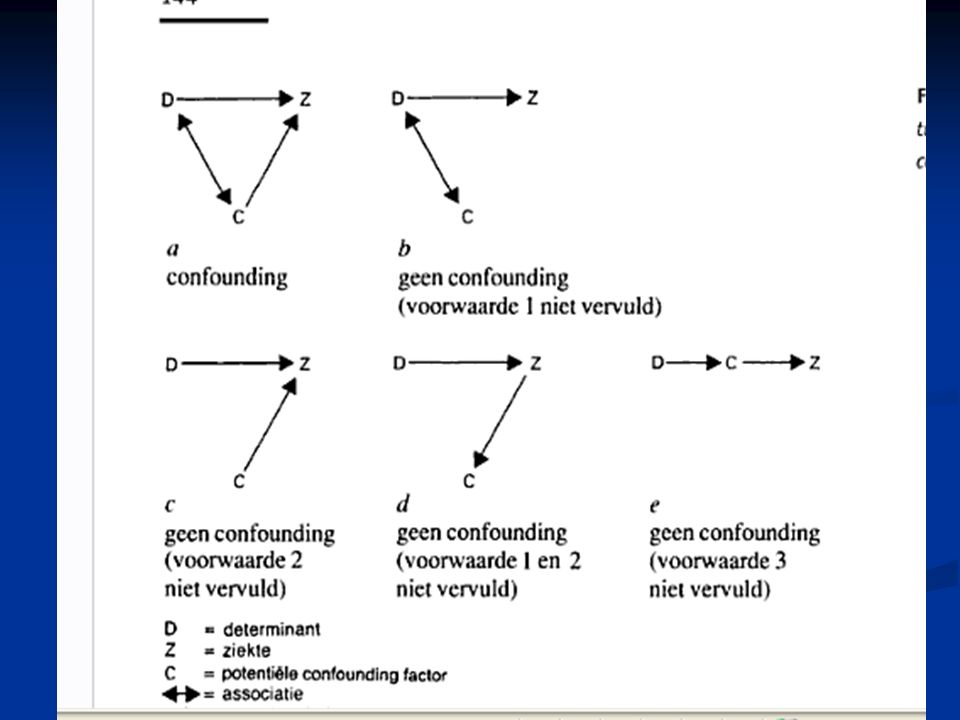
*Confounding

32
DZ C

34
alcoholHartinfarct HDL

36
Bias Chance Typen data Verdelingen SD vs SE Odds Sens, Spec LR } } } Hoofdstuk 1 Hoofdstuk 2 Hoofdstuk 3

37
Nominaal Ordinaal Interval * continu * discreet

38
Bilirubine = 18 umol/l

39
Bloedgroep A

40
Para 3

41
Proteinurie +++

43
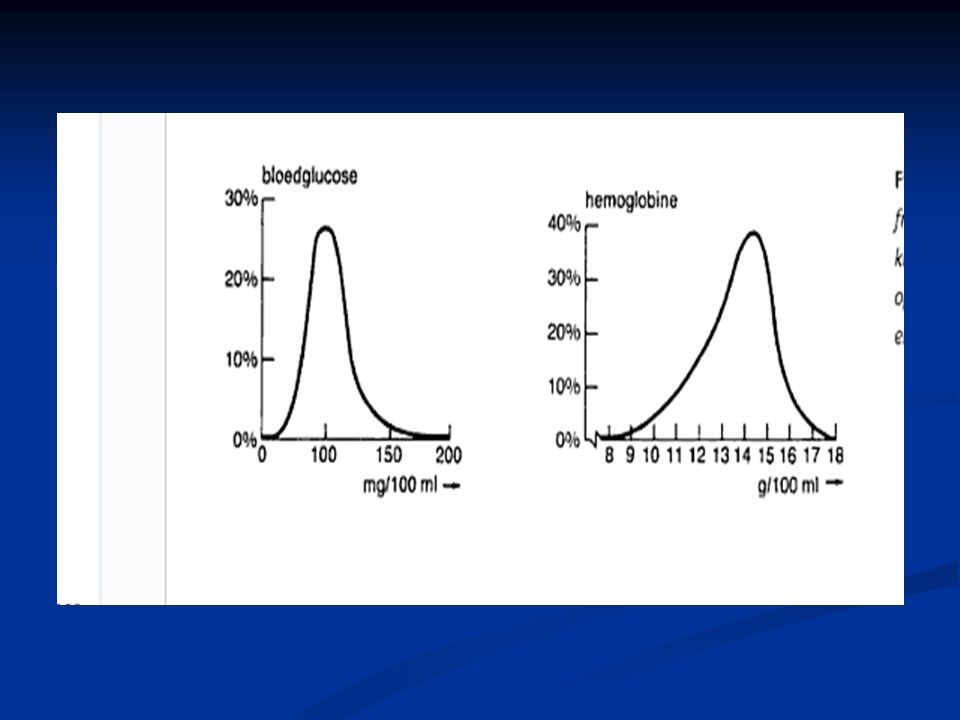
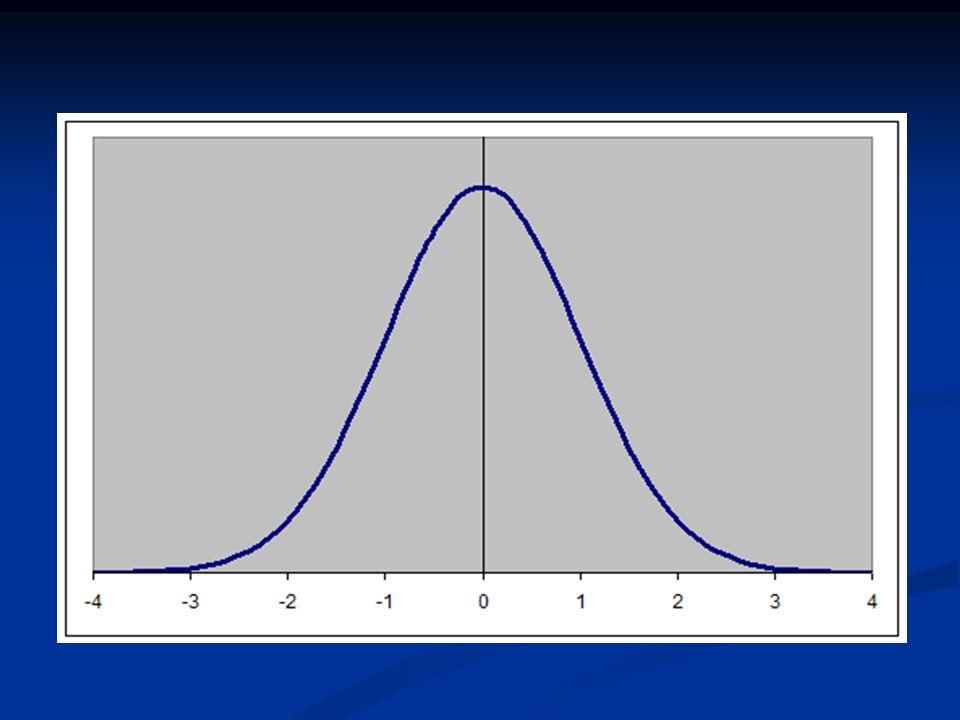
Continue data

44
Getallenreeks 2 karakteristieken

45
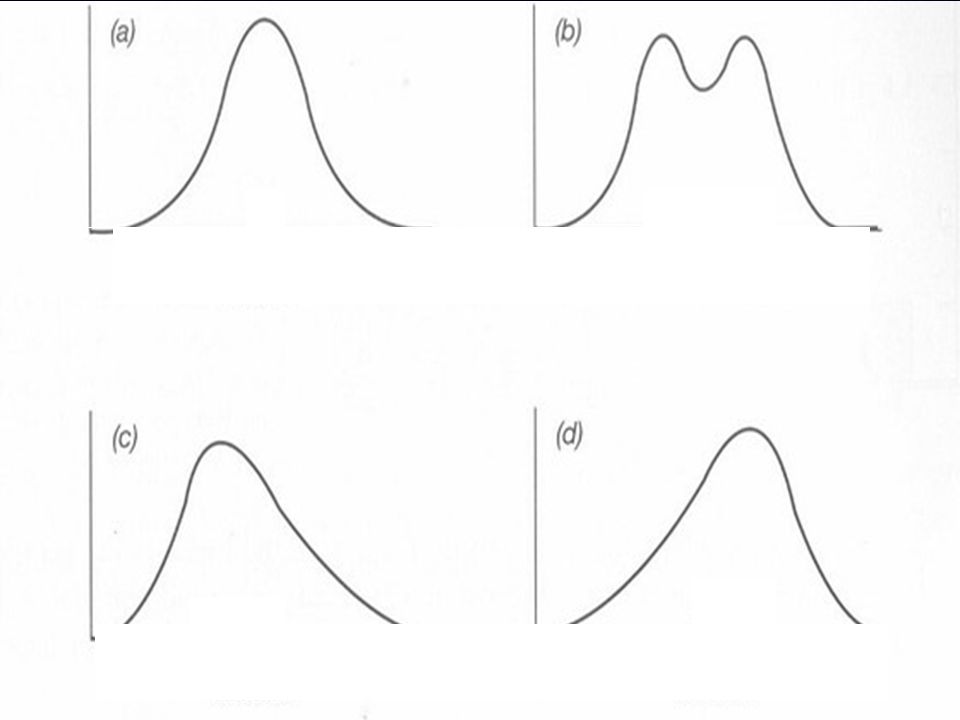
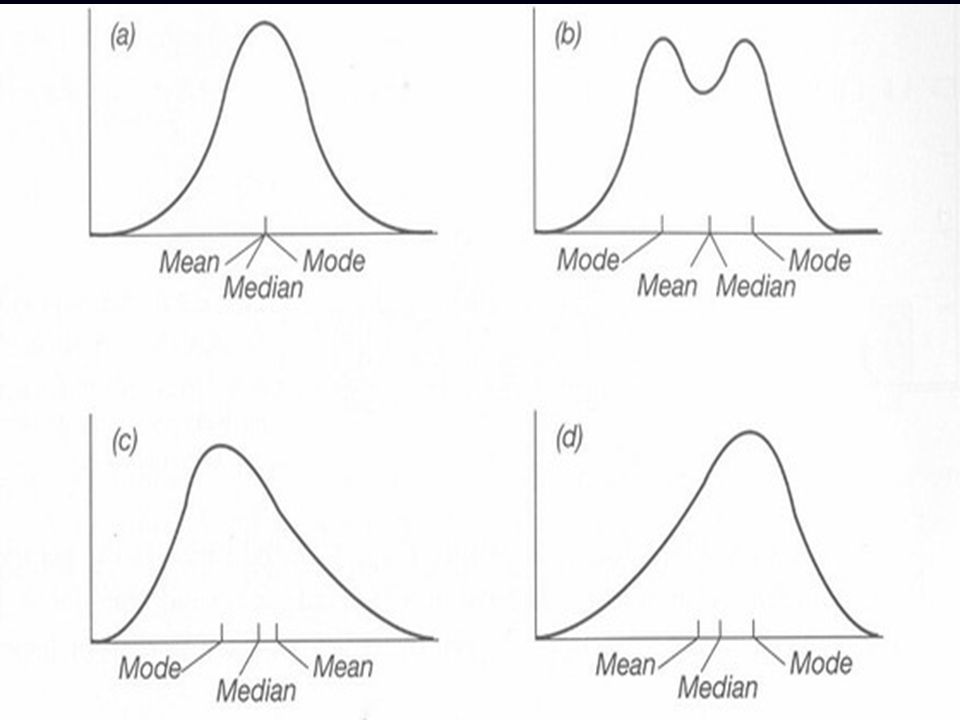
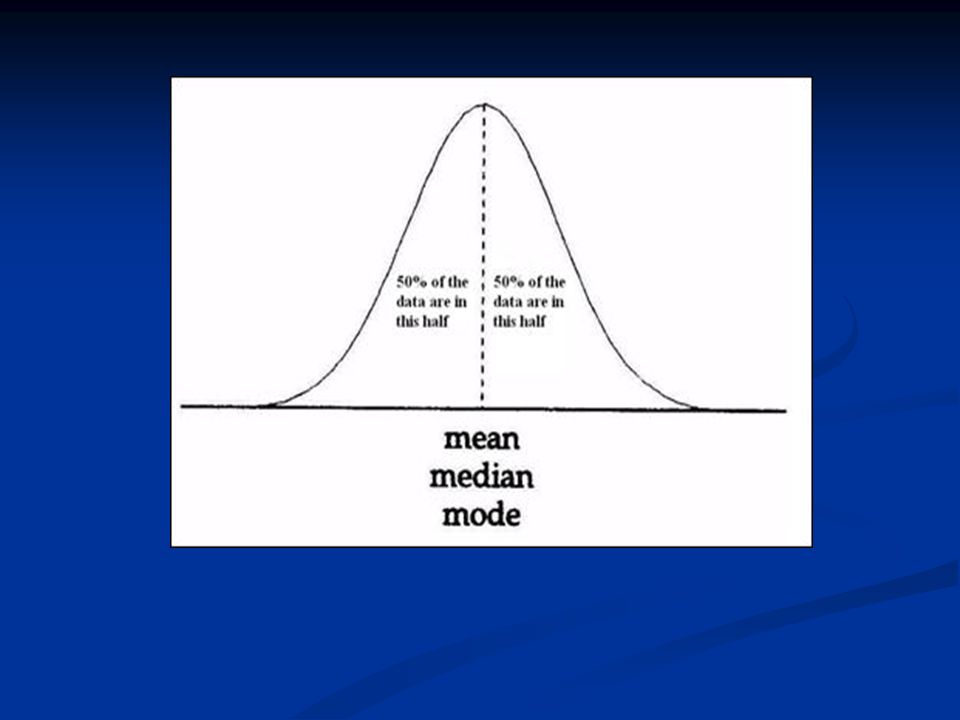
Spreiding Centrale tendens

46
Spreiding (gem, mediaan, modus) Centrale tendens (percentiel, range, standaarddeviatie)
 Centrale tendens (percentiel, range, standaarddeviatie)")
54
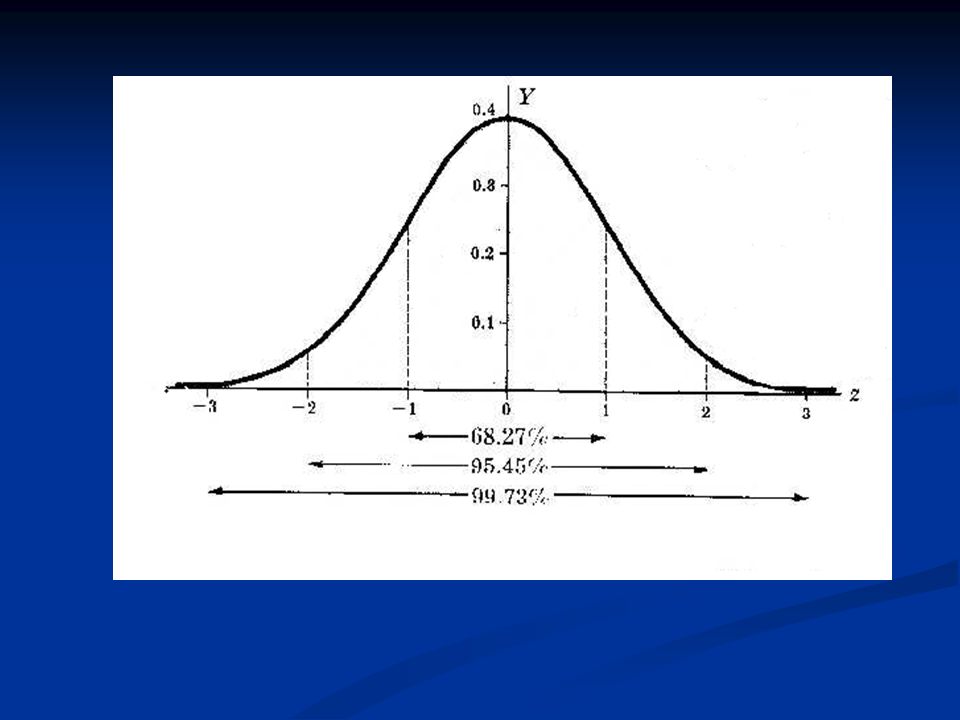
Standaarddeviatie = Gemiddelde verschil van alle metingen ten opzichte van het gemiddelde

56
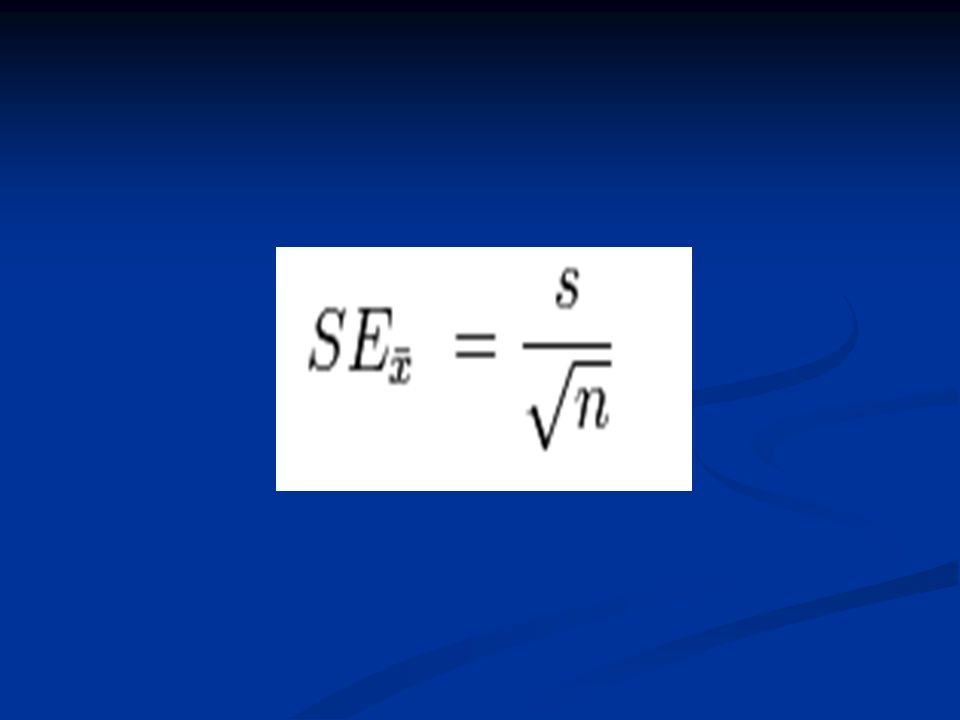
Standaarddeviatie vs Standaard error

57
= Precizie van schatting van het gemiddelde

60
Vb Nederlandse mannen gemiddeld 1,71 meter, gemeten in 1.000.000 mannen. SD = 4 cm (= 95% vd mannen is 1,63-1,79 m) SE = 4/ 1.000.000 = 4/1000 (=met 95% zekerheid ligt het echte gemiddelde tussen 1,706 – 1,714)
 SE = 4/ = 4/1000 (=met 95% zekerheid ligt het echte gemiddelde tussen 1,706 – 1,714).")
61
Conclusies Waarde wijkt af van echte waarde Bias Random variatie Drie typen bias Vier verschillende datatypes Continu: spreiding en centrale tendens Normale verdeling SD vs SE

Verwante presentaties