Download de presentatie
De presentatie wordt gedownload. Even geduld aub

1
Frans Aarts ( Wageningen-UR)
Kringloopwijs! PZ studiedag, 27 november 2012 Frans Aarts ( Wageningen-UR)
")
2
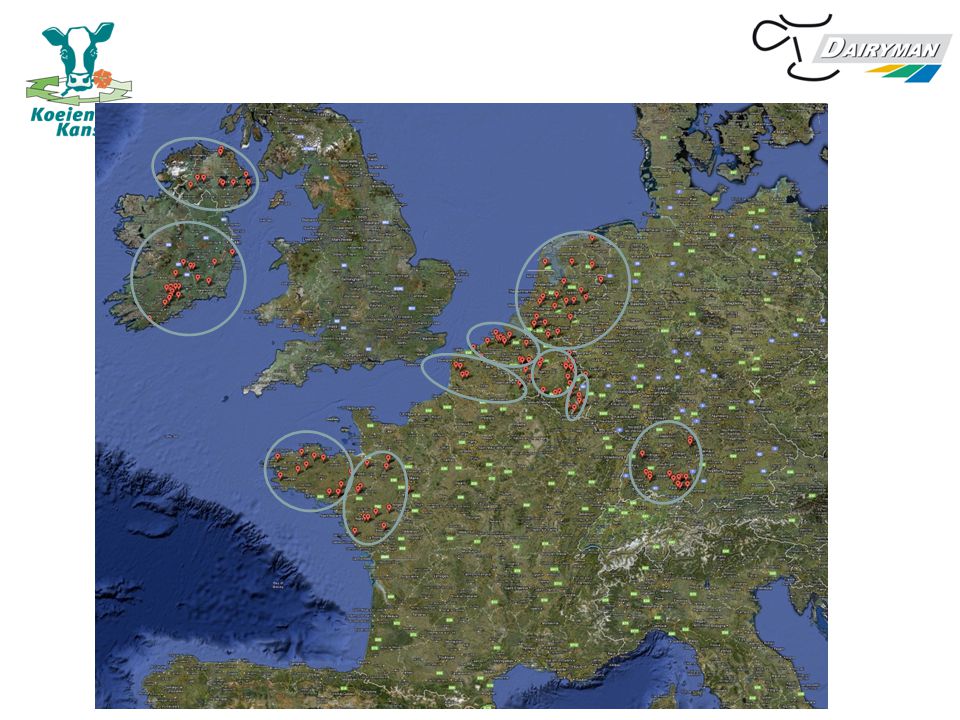
KringloopWijzer De Marke Koeien & Kansen DAIRYMAN 1992 1999 2010 2012

4
National Emissions Ceilings Directive Climate Change Programme
Verlies ammoniak, stikstofoxide, methaan Verlies N,P en C uit kringloop For the dairy sector the main directives are the Nitrate Directive, The Water Framework Directive and the national Emissions Ceiliongs Directive are most important directives. Also the Climate Change programme of the EU is important. All these focus on reduction of losses from the N, P and C cycle of the farm. So force farmers to optimize these cycles by a better resource management. Nitrate Directive Water Framework Directive Verlies nitraat en fosfaat

5
National Emissions Ceilings Directive Climate Change Programme
Verlies ammoniak, stikstofoxide, methaan Verlies N,P en C uit kringloop = onbenut deel voer en meststoffen For the dairy sector the main directives are the Nitrate Directive, The Water Framework Directive and the national Emissions Ceiliongs Directive are most important directives. Also the Climate Change programme of the EU is important. All these focus on reduction of losses from the N, P and C cycle of the farm. So force farmers to optimize these cycles by a better resource management. Nitrate Directive Water Framework Directive Verlies nitraat en fosfaat

6
Beter functioneren kringlopen
Betere milieukwaliteit Minder voer en meststoffen nodig Efficient boeren voelt prettig 25% beter moet mogelijk zijn Nodig: kennis, innovaties, zelfvertrouwen, aangepaste wetgeving, beloning

7
Melkveehouderij Kringloop-landbouw: Typisch NL:
In NL 75% eigen voer, 70 – 100 % eigen N- en P- meststof Typisch NL: Gespecialiseerd Weing grond, veel melk (= weinig grond per kg melk) Daardoor milieu-risico groot (veel mest) Milieuschade voorkomen door uitstekend kringloop-management
 Daardoor milieu-risico groot (veel mest) Milieuschade voorkomen door uitstekend kringloop-management.")
8
Dairy farm specialized
Dairy farm with at least two other productions Dairy farm with energy production Dairy farm with arable crops Dairy farm with beef cattle

9
Area average dairy farm
% grassland % forage crops % arable land graphic representation of average farm size (ha), and distribution grassland – forage crops – arable land Average farm size ranges from 45 ha in Flanders to over double this area, with 96 ha in FL, large differences in use of the available land, which much more land for arable production in regions like FN, FL, FB (more mixed farms, combination with arable production, …)
, and distribution grassland – forage crops – arable land. Average farm size ranges from 45 ha in Flanders to over double this area, with 96 ha in FL, large differences in use of the available land, which much more land for arable production in regions like FN, FL, FB (more mixed farms, combination with arable production, …)")
10
Herd average dairy farm
Conclusions: most regions average dairy herd is between 45 and 55-56, with larger herds in Northern Ireland and the Netherlands, More variation in young stock numbers ranging. In most regions, the ratio young stock/dairy cows<1, so less young stock then dairy cows, the most extreme in NPdC, with a ratio of 0,3 (so almost one number of young stock per 3 dairy cows, in IN, this is 0,5, for most other regions this ratio is closer to 1. The exceptions are BW and GE, where young stock numbers exceed the number of dairy cows on the farm (explanation?)
")
11
Milk production average dairy farm
Description results: highest yield: the Netherlands, in combination with on average large herds: highest average milk production per farm Most intensive systems in NL and BF, with production levels of over 10,000 kg/ha grass + forage; more autonomy in other regions, eg comparison BF and BW: on average equal milk yield per cow, but less per ha grassland + forage, which means more land for dairying in BW, more autonomy. …

12
Nitrogen Balance = surplus

13
Phosphorous Waarom geen extra sheet met P-efficiency?

14
Starting point and ambition
Good Ecological Status Unknown Ecological Status Water Framework Directive Starting point and ambition Exemptions

15
Dairy Economics – Costs and revenues (4)
")
16
Wat te verbeteren: de zorgen van de veehouder
BF BW FB FL FN GE IN IR LU NL High land prices H M Low income Costs manure surplus L Price fluctuations (input/output) High workload/lack of free time Administrative burden related to regulations Lack of education/skills to use innovations Lack of farm successors
 High workload/lack of free time. Administrative burden related to regulations. Lack of education/skills to use innovations. Lack of farm successors.")
17
Wat te verbeteren: de zorgen van het milieu
BF BW FB FL FN GE IN IR LU NL Air quality Ammonia 4 3 2 1 5 GHG Water quality nitrate phosphate pesticides Soil quality Erosion Fertility Biodiversity

18
Op naar de top

19
National Emissions Ceilings Directive Climate Change Programme
Verlies ammoniak, stikstofoxide, methaan Verlies N,P en C uit kringloop For the dairy sector the main directives are the Nitrate Directive, The Water Framework Directive and the national Emissions Ceiliongs Directive are most important directives. Also the Climate Change programme of the EU is important. All these focus on reduction of losses from the N, P and C cycle of the farm. So force farmers to optimize these cycles by a better resource management. Nitrate Directive Water Framework Directive Verlies nitraat en fosfaat

20
Optimaliseren bedrijf
Resultaten KringloopWijzer Grondstof voor een zinnig onderhoud met uw adviseur Measures should be an answer on wanted improvements, emerging from a diagnosis of N-cycle assesment. Diagnoses means comparing the figures of the N-cyle (internal flows, external flows, losses, efficiencies of the compoments of the farming system and of the farm as a whole) with target (wanted) values. Measures should contribute to fill the gap between actual and wants. Measure should be selected on the cost-effectiveness (taking into accout trade offs). A farm development plan should describe implementation and how to monitor effects. An annual farm performance report (environmental score) should present realised progress. Diagnose (‘kringloop-signalen’) passende strategie & maatregelen
 with target (wanted) values. Measures should contribute to fill the gap between actual and wants. Measure should be selected on the cost-effectiveness (taking into accout trade offs). A farm development plan should describe implementation and how to monitor effects. An annual farm performance report (environmental score) should present realised progress. Diagnose. (‘kringloop-signalen’) passende strategie & maatregelen.")
21
Geen kennis van kringloop: = dwalen in het donker!
?? Measures should be an answer on wanted improvements, emerging from a diagnosis of N-cycle assesment. Diagnoses means comparing the figures of the N-cyle (internal flows, external flows, losses, efficiencies of the compoments of the farming system and of the farm as a whole) with target (wanted) values. Measures should contribute to fill the gap between actual and wants. Measure should be selected on the cost-effectiveness (taking into accout trade offs). A farm development plan should describe implementation and how to monitor effects. An annual farm performance report (environmental score) should present realised progress. diagnose passende strategie & maatregelen
 with target (wanted) values. Measures should contribute to fill the gap between actual and wants. Measure should be selected on the cost-effectiveness (taking into accout trade offs). A farm development plan should describe implementation and how to monitor effects. An annual farm performance report (environmental score) should present realised progress. diagnose. passende strategie & maatregelen.")
22
Geen kennis van kringloop: = dwalen in het donker!
Als je niet weet waar je naar toe wilt is elke weg goed. Measures should be an answer on wanted improvements, emerging from a diagnosis of N-cycle assesment. Diagnoses means comparing the figures of the N-cyle (internal flows, external flows, losses, efficiencies of the compoments of the farming system and of the farm as a whole) with target (wanted) values. Measures should contribute to fill the gap between actual and wants. Measure should be selected on the cost-effectiveness (taking into accout trade offs). A farm development plan should describe implementation and how to monitor effects. An annual farm performance report (environmental score) should present realised progress. diagnose passende strategie & maatregelen
 with target (wanted) values. Measures should contribute to fill the gap between actual and wants. Measure should be selected on the cost-effectiveness (taking into accout trade offs). A farm development plan should describe implementation and how to monitor effects. An annual farm performance report (environmental score) should present realised progress. diagnose. passende strategie & maatregelen.")
23
Wetgeving De overheid als boer: voorschrijven maatregelen om daarmee kringlopen te sturen (zonder nauwkeurige kennis daarvan) De overheid als controleur: boer moet duurzaam produceren kunnen verantwoorden (kiest zelf de maatregelen)
")
24
Nut KringloopWijzer Brengt jaarlijks de N-, P- en C-kringloop in beeld, waardoor: Verantwoording kan worden afgelegd (overheden, zuivel) Inzicht wordt geboden in efficiëntie van benutting voer en meststoffen ( bedrijfsoptimalisatie) Biedt alternatief voor generiek wettelijk voorgeschreven handelings-voorschriften Standaard die door alle partijen wordt gebruikt
 Biedt alternatief voor generiek wettelijk voorgeschreven handelings-voorschriften. Standaard die door alle partijen wordt gebruikt.")
25
Kringloopscore: benuttingen (met als voorbeeld N)
Kuks 2011 Gemiddelde NL

26
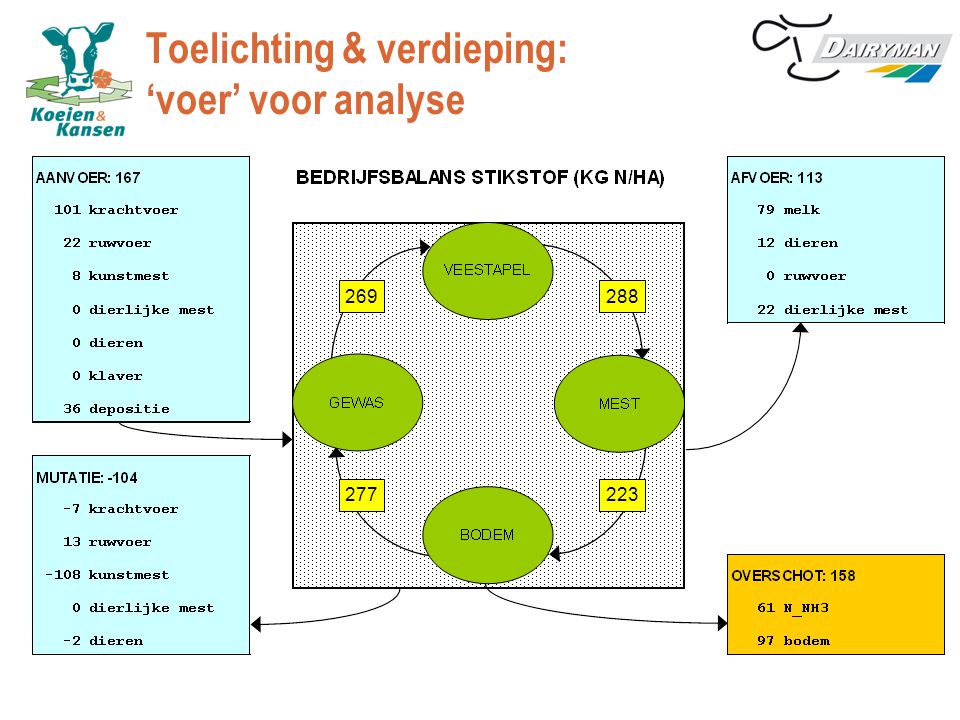
Toelichting & verdieping: ‘voer’ voor analyse
269 277 223 288
27
Uitvergroting veestapel (kg N/ha)
")
28
Uitvergroting bodem (kg P2O5/ha)
")
29
Eisen aan KringloopWijzer
Wetenschappelijk ‘state of the art’ Fraudebestendig (Borging BEX) Beperkte administratieve lasten en andere kosten
 Beperkte administratieve lasten en andere kosten.")
30
Voorwaarde: fraudebestendig!
Berekeningen met gegevens die digitaal zijn vastgelegd (voerleverancier, melkafnemer, overheden, etc.) Inlezen van deze gegevens, dus zonder dat er vingers tussen zitten Resultaten centraal digitaal opslaan en controleren
 Inlezen van deze gegevens, dus zonder dat er vingers tussen zitten. Resultaten centraal digitaal opslaan en controleren.")
31
Samenwerking Alle landbouworganisaties Overheden Alle melkverwerkers
Voerleveranciers, accountants Wageningen-UR, Boerenverstand, PPP-agro Advies CRV BLGG

32
BEX: feed input, turn over of N and P by cattle, excretion N and P
LOSSES FEEDS FERTILISER MILK ANIMALS CATTLE MANURE CROP SOIL BEX LOSSES LOSSES

33
BEA: ammonia losses from excrements and mineral fertilisers
FEEDS FERTILISER MILK ANIMALS CATTLE MANURE CROP SOIL BEX BEA LOSSES LOSSES

34
BEP: crop yields (DM, P), utilisation P-fertilisers, soil surplus P
LOSSES FEEDS FERTILISER MILK ANIMALS CATTLE MANURE CROP SOIL BEX BEA LOSSES LOSSES BEP

35
BEN: crop yields (N), utilisation N-fertilisers, soil surplus N, N-accumulation soil, nitrate, N2O
LOSSES FEEDS FERTILISER MILK ANIMALS CATTLE MANURE CROP SOIL BEX BEA LOSSES BEN LOSSES BEP

36
BEC: CH4, CO2, C content soil
LOSSES FEEDS FERTILISER MILK ANIMALS CATTLE MANURE CROP SOIL BEX BEC BEA LOSSES BEN LOSSES BEP

37
BEA BEP N, P and C-cycles quantified! BEC BEX BEN

38
Opbouw kringloop BEX BEA BEP/BEN KRACHTVOER MELK VEE VEESTAPEL RUWVOER
MEST BEX GEWAS BEA MEST BEP/BEN KUNSTMEST KLAVER DEPOSITIE BODEM NH3 P, N2, N2O, NO3

39
Performances to be presented
- Feed consumption and efficiency of turn over of N and P into milk + bodyweight - Excretion of N and P - Ammonia losses from excrements and mineral fertilisers - Crop yields: N, P, C, energy (kVEM) - Fertiliser applications and efficiency of turn over of fertilisers into crops - Surpluses of N, P and C on farm balance - Surpluses of N, P and C on soil balance - Nitrate content groundwater (model calculated based on N-soil surplus and soil characteristics - Dynamics C-content soil (C- sequestration) - Green House Gas emissions (model calculated with farm specific data)
 - Fertiliser applications and efficiency of turn over of fertilisers into crops. - Surpluses of N, P and C on farm balance. - Surpluses of N, P and C on soil balance. - Nitrate content groundwater (model calculated based on N-soil surplus and soil characteristics. - Dynamics C-content soil (C- sequestration) - Green House Gas emissions (model calculated with farm specific data)")
40
BEX BEA BEP BEN BEC ontwikkeling * fase 1 fase 2 fase 3 fase

41
BEX: feed input, turn over of N and P by cattle, excretion N and P
LOSSES FEEDS FERTILISER MILK ANIMALS CATTLE MANURE CROP SOIL BEX LOSSES LOSSES

42
Principe norm excretie: balans dier-deel kringloop
Melkproductie Vastlegging Excretie Voeropname Gemiddeld NL

43
Principe BEX balans dier-deel kringloop
Melkproductie Vastlegging Excretie Voeropname Bedrijfspecifiek

44
N flow (kg/year) of the standard Dutch dairy cow
Live weight 600 kg Grass silage Kg dm g N/kg dm Corn silage Kg dm g N/kg dm Concentrates Kg dm g N/kg dm Pasture grass Kg dm g N/kg dm Volatilisation 17 kg N Accretion 2 kg N Gross excretion 137 kg N ( – 2) Intake 180 kg N (stikstof) Milk 41 kg N N-manure (137-17) x 0.95 = 114 kg N Milk kg %protein urea (mg/100 g) Young stock>1 Kg N Young stock<1 Kg N
 Intake. 180 kg N. (stikstof) Milk. 41 kg N. N-manure. (137-17) x 0.95 = 114 kg N. Milk. kg %protein 3.5. urea (mg/100 g) 26. Young stock>1 Kg N 66. Young stock<1. Kg N 31.")
45
Comparison N excretion
Above line y =x …. C&O excretion higher than BEX

46
Stikstofvoordeel t.o.v. van de forfaitaire norm (%)
")
47
Fosfaatvoordeel t.o.v. van de forfaitaire norm (%)
")
48
Besparing mestafzet KK-bedrijven
Periode 2009 – 2011: gemiddeld: 375 m3 hoogste: 700 m3

49
Deelname BEX Brabant doet het goed in deelname BEX.

50
Average N excretion X %TAN
NEMA/BEA N-excretion %TAN average Average N excretion X %TAN Total Ammonia N Manure storage Coëff TAN in manure storage N-fertilizer slurry + solid manure pasturing N-fertilizer Arable land Grass land

51
Characteristics example farms
2006 NL average Hoefmans Van Hoven Utilization digested feed protein cows (%) 37.2 40.8 36.5 N efficiëncy cows (%) 25.9 28.5 25.6 Number of cows 88 102 Milk production (kg) 681472 768394 790811 Milk fat (%) 4.39 4.36 4.56 Milk protein (%) 3.48 3.47 3.42 Grazing in days per year 125 64 192 Grazing in hours per day 7 6 12 Crude protein content ration (g/kg dm) 161.5 152.5 159.5
 N efficiëncy cows (%) Number of cows Milk production (kg) Milk fat (%) Milk protein (%) Grazing in days per year Grazing in hours per day Crude protein content ration (g/kg dm)")
52
Results for Dutch farms
2006 NL average Hoefmans Van Hoven Kg NH3-N per 1000 kg milk ) Stable and storage 35.2 34.2 35.6 Slurry application grassland 47.3 47.8 39.8 Slurry application arable land 12.8 13.9 15.9 Application N-fertlizers 3.3 3.8 4.2 Pasturing 1.7 0.5 4.8 %TAN Year 61.9 57.5 62.8 Grazing period 68.2 67.8 Stable period 56.0 51.6 1) Total farm emission in tons of NH3-N
 Stable and storage Slurry application grassland Slurry application arable land Application N-fertlizers Pasturing %TAN. Year Grazing period Stable period ) Total farm emission in tons of NH3-N.")
53
BEP Bodem/gewas-deel kringloop
Opbrengst gewas-P Toegestaan overschot P Bemesting-P Bedrijfspecifiek

54
Fosfaatopbrengst grasland (BIN-bedrijven)
")
55
Dank voor de aandacht

Verwante presentaties