Download de presentatie
De presentatie wordt gedownload. Even geduld aub

1
SOCIAAL KAPITAAL EN WELVAART Prof. Em. Wim Moesen Centrum voor Economische Studiën Katholieke Universiteit Leuven Seniorenuniversiteit UHasselt 21 september 2009

2
INHOUD 1.SOCIAAL KAPITAAL EN ECONOMISCHE WELVAART Transmissiemechanisme 2.METEN EN VALIDEREN Empirische bevindingen 3.STERKTEN- ZWAKTENANALYSE Beleidsconclusies

3
FORMELE INSTELLINGEN (wetten, regels, organisaties…) INFORMELE INSTELLINGEN (normen, conventies, taboes…) CULTURELE WAARDEN SOCIAAL KAPITAAL
 INFORMELE INSTELLINGEN (normen, conventies, taboes…) CULTURELE WAARDEN SOCIAAL KAPITAAL")
4
ECONOMISCHE PERFORMANTIE WELVAART VERTROUWEN SOCIAAL KAPITAAL

5
TRANSMISSIEMECHANISME? Vermindert transactiekosten Verhoogt productiviteit Macro-economische performanties Vertrouwen

6
Francis FUKAYAMA (1995) “Trust: the social virtues and economic prosperity” BENADERING VAN DE TRANSACTIEKOSTEN Douglas NORTH (1993) Oliver WILLIAMSON (1975, 1979, 1985)
 Trust: the social virtues and economic prosperity BENADERING VAN DE TRANSACTIEKOSTEN Douglas NORTH (1993) Oliver WILLIAMSON (1975, 1979, 1985)")
7
TRUST AND RETURNED WALLETS

8
MAATSCHAPPELIJK KAPITAAL EN VERTROUWEN Vertrouwen in de publieke sector Maatschappelijk kapitaal Beïnvloedt vertrouwen in de maatschappij Beïnvloedt economische performantie = cultuur van de maatschappij Met- formele beperkingen grondwet, wetten,… - informele beperkingen morele waarden, attitudes,…

9
METEN EN VALIDEREN DATA ECONOMISCHE PERFORMANTIE DATA CULTURELE WAARDEN BEVINDINGEN

10
DE CONSTRUCTIE VAN EEN COMPOSIET- INDEX VOOR DE METING VAN PERFORMANTIE SCOPE: WELKE INDICATOREN? NORMALISERING: HOE HERSCHALEN? AGGREGATIE: WELKE WEGING?

11
SYNTHETISCHE INDICATOR VAN MACRO- ECONOMSICHE PERFORMANTIE TINBERGEN REELE GROEI WERKLOOSHEID LOPENDE REKENING BETALINGSBALANS INFLATIE

12
VERTROUWEN IN PUBLIEKE SECTOR & ECONOMISCHE PERFORMANTIE Groei BBP Meetinstrumenten: economische performantie Inflatie Wekloosheidsgraad Saldo op lopende rekening 4 factoren 2 maatstaven 2 families SimepLimep OngewogenGewogen Simep 4 / Limep 4 Simep 3 / Limep 3 Met saldo Lopende rekening zonder saldo Lopende rekening

13
DATA CULTURELE WAARDEN Twee indicatoren: (1)Vertrouwen in publieke sector: synthetische maatstaf Favoritisme Onafhankelijkheid rechterlijke macht 5 ingrediëntenCorruptie Regeringsverbintenissen Vertrouwen in eerlijkheid van politici (2) Werkethiek (arbeidsmotivatie, loyauteit,…)
Vertrouwen in publieke sector: synthetische maatstaf Favoritisme Onafhankelijkheid rechterlijke macht 5 ingrediëntenCorruptie Regeringsverbintenissen Vertrouwen in eerlijkheid van politici (2) Werkethiek (arbeidsmotivatie, loyauteit,…)")
14
BEVINDINGEN: REGRESSIERESULTATEN Afhankelijke Variabele Intercept (Stand. Dev.) Werkethiek (Stand. Dev.) Vertrouwen in Publieke sector (Stand. Dev.) R2R2 SIMEP 4-0.761 (0.288) +0.162 (0.046) +0.069 (0.031) 0.525 LIMEP 4-0.801 (0.364) +0.188 (0.058) +0.071 (0.039) 0.466 SIMEP 3-0.625 (0.318) +0.137 (0.050) +0.070 (0.034) 0.424 LIMEP 3-0.699 (0.402) +0.171 (0.064) +0.070 (0.043) 0.380
 Werkethiek (Stand. Dev.) Vertrouwen in Publieke sector (Stand. Dev.) R2R2 SIMEP (0.288) (0.046) (0.031) LIMEP (0.364) (0.058) (0.039) SIMEP (0.318) (0.050) (0.034) LIMEP (0.402) (0.064) (0.043)")
15
EMPIRICS: GRAPHICAL

16
CLASSIFICATIE VAN LANDEN

17
Global Competitiveness Report 2008-2009 What is competitiveness? The World Competitiveness Report defines competitiveness as the set of institutions, policies, and factors that determine the level of productivity of a country

18
Global Competitiveness Report 2008-2009 Problems when constructing a Composite Indicator 1.Problem of scope 2. Problem of normalisation 3. Problem fo weighting

19
The index is composed of 12 pillars measuring different aspects of an economy’s competitiveness Basic Requirements I.Institutions II.Infrastructure III.Macroeconomic stability IV.Health and primary education Efficiency Enhancers V.Higher education and training VI.Goods market efficiency VII.Labor market efficiency VIII.Financial market sophistication IX.Technological readiness X.Market size Innovation and sophistication factors XI.Business sophistication XII.Innovation Key for factor-driven economies Key for efficiency-driven economies Key for innovation-driven economies

20
Survey methodology -The hard data indicators used in the GCI are normalized on a 1- to 7- scale -Official public sources are often insufficient for painting an accurate picture of a country’s business operating environment. -> Executive opinion survey: Soft Data

21
Executive Opinion Survey -Survey conducted by Partner Institutes - Vlerick Leuven Gent Management School exclusively for Belgium -Overall, 12.297 business leaders were questioned in a 134 national economies -Average of 90 responses per country - Belgium received 109 responses! - Random selection based on sector share in national GDP

22
Belgium’s Competitiveness Rank: 2001-2008 Growth Competitiveness Index (Old series) Global Competitiveness Index (New series)
 Global Competitiveness Index (New series)")
23
The Global competitiveness index - ranking RankCountry Scor eRank last year 1United States5,741 2Switzerland5,612 3Denmark5,583 4Sweden5,534 5Singapore5,537 6Finland5,506 7Germany5,465 8Netherlands5,4110 9Japan5,388 10Canada5,3713 11Hong Kong SAR5,3312 United Kingdom5,309 RankCountryScorRank last year 13Korea, rep.5,2811 14Austria5,2315 Norway5.2216 France5.2218 17Taiwan, China5.2214 18Australia5.2019 Belgium5.1420 Iceland5.0523 21Malaysia5.0421 22Ireland4.9922 23Israel4.9717 24New Zealand4.9324 25Luxembourg4.8525

24
Important changes 2008-2009 vs. 2007-2008 CountryRanking 2008-2009Ranking 2007-2008Change United States11= Switzerland22= Denmark33= Sweden44= Singapore57+2 Germany75-2 Netherlands810+2 Japan98 United Kingdom129-3 France1618+2 Belgium1920+1 Luxembourg25 = China3034+4 India5048-2 - No changes in top 4, Singapore enters top 5 - France, the UK and the Netherlands were already better ranked than Belgium and are characterized by major improvements. Germany stays ahead of Belgium. - Improvements in China whereas India fell to the 50th place

25
Pillar Rankings higher than our 19th position Which pillars pushed us forward? Name Belgium’s Rank 2008 Belgium’s Rank 2007Score Health and primary education3136.5 Higher education and training6115.6 Business sophistication11125,4 Goods market efficiency12215.2 Innovation14164.7 Infrastructure16155.6

26
Pillar Rankings lower than our 19th position Which pillars pulled us backward? NameRank 2008Rank 2007Score Financial market sophistication23225.2 Institutions21235,2 Technological readiness23245.0 Market size25 4.8 Macroeconomic stability60655.1 Labor market efficiency79914.3

27
Belgium’s 10 best single items PillarNameRank Health and primary educationMalaria incidence1 Health and primary educationQuality of primary education2 Higher education and trainingQuality of math and science education3 Goods market efficiencyTime required to start a business3 Higher education and trainingQuality of educational system4 Goods market efficiencyNo. of procedures required to start a business4 Higher education and trainingQuality of management schools5 InnovationQuality of scientific research institutions5 Business sophisticationLocal supplier quality5 Goods market efficiencyTrade-weighted tariff rate5

28
Belgium’s 10 most unfavourable single items PillarName Rank 2008 Rank 2007 Goods market efficiencyExtent and effect of taxation132130 Labor market efficiencyNon-wage labor costs128124 Labor market efficiencyFlexibility of wage determination121125 Macroeconomics stabilityGovernment debt119113 Labor market efficiencyHiring and firing practices117125 Goods market efficiencyTotal tax rate114108 Labor market efficiencyPay and productivity96106 InstitutionsBurden of government regulation95 Labor market efficiencyCooperation in labor-employer relations94108 Macroeconomics stabilityGovernment surplus/deficit6351

29
Benchmark of Belgium’s 10 most favourable items Name Rank Belgium Rank The Netherlands Rank France Rank Germany Rank Luxembourg Rank UK Malaria incidence111111 Quality of primary education2138363028 Quality of math and science education 3164445447 Time required to start a business3179385624 Quality of educational system41320234128 No. of procedures required to start a business 41995819 Quality of management schools5101218618 Quality of scientific research institutions 510166537 Local supplier quality561023323 Trade-weighted tariff rate555555

30
Benchmark of Belgium’s 10 most unfavourable items Name Rank Belgium Rank The Netherlands Rank France Rank Germany Rank Luxembourg Rank UK Extent and effect of taxation 13260991051281 Non-wage labor costs12875127804635 Flexibility of wage determination 1211221031319823 Government debt119901061051577 Hiring and firing practices11712412613011361 Total tax rate11464115893538 Pay and productivity969082516732 Burden of government regulation 9581126772782 Cooperation in labor- employer relations 949132272035 Government surplus/deficit 6352955840105

31
The most problematic Factors for doing business in Belgium - Restrictive labour regulations (19,2 % of responses) - Tax rates (17,3% of responses) - Inefficient government bureaucracy (12,2% of responses) - Tax regulations (11,1% of responses) - Inadequately educated workforce (9,8% of responses)
 - Tax rates (17,3% of responses) - Inefficient government bureaucracy (12,2% of responses) - Tax regulations (11,1% of responses) - Inadequately educated workforce (9,8% of responses)")
32
VERTROUWEN IN BELGISCHE OVERHEIDSINSTELLINGEN Gezondheidszorg82,6 Onderwijs77,9 Sociale zekerheid69,4 Politie55,4 Overheidsadministratie46,1 Parlement39,1 Justitie36,4 (Bron: European Values Study, 2000)
")
33
VERTROUWEN IN INSTELLINGEN (2002) Onderwijs79,1% Gemeentelijke administratie52,5% Vlaamse Administratie40,4% Gerecht30,1% (Bron: Instituut voor de Overheid, Werken aan de Overheid)
 Onderwijs79,1% Gemeentelijke administratie52,5% Vlaamse Administratie40,4% Gerecht30,1% (Bron: Instituut voor de Overheid, Werken aan de Overheid)")
34
TRUST IN INSTITUTIONS BDKEU-15 Justice/National Legal System368051 Police578967 Army567466 Trade Unions485236 Big Companies405029 Charitable or voluntary organisations576459 Eurobarometer 2003

35
One of the most problematic factors for doing business in Belgium Inefficient government bureaucracy Trust in Belgian institutions

36
Government effectiveness Data on Government Effectiveness → borrowed from World Bank: Kaufmann et al., ‘Governance Matters’, (edition 2007) - Survey data for 212 countries - Composite indicator
 - Survey data for 212 countries - Composite indicator")
37
Global competitiveness versus government effectiveness GCIcoefficient Std. Errorp-value constant4.1230.2020.000 effectivene ss0.6270.1190.665 R-squared0.570

38
Government effectiveness and budget size

39
Global Competitiveness Index versus budget size.

40
Global Competitiveness Index versus budget size – bivariate econometrics GCIcoefficientStd. Errorp-value constant4.8980.5710.000 budget size0.0060.0130.665 R- squared0.009

41
Global Competitiveness Index versus budget size – clusters of countries.

42
Government effectiveness versus budget size effectivenesscoefficientStd. Errorp-value constant0.8240.6670.230 budget size0.0180.0150.235 R-squared0.067

43
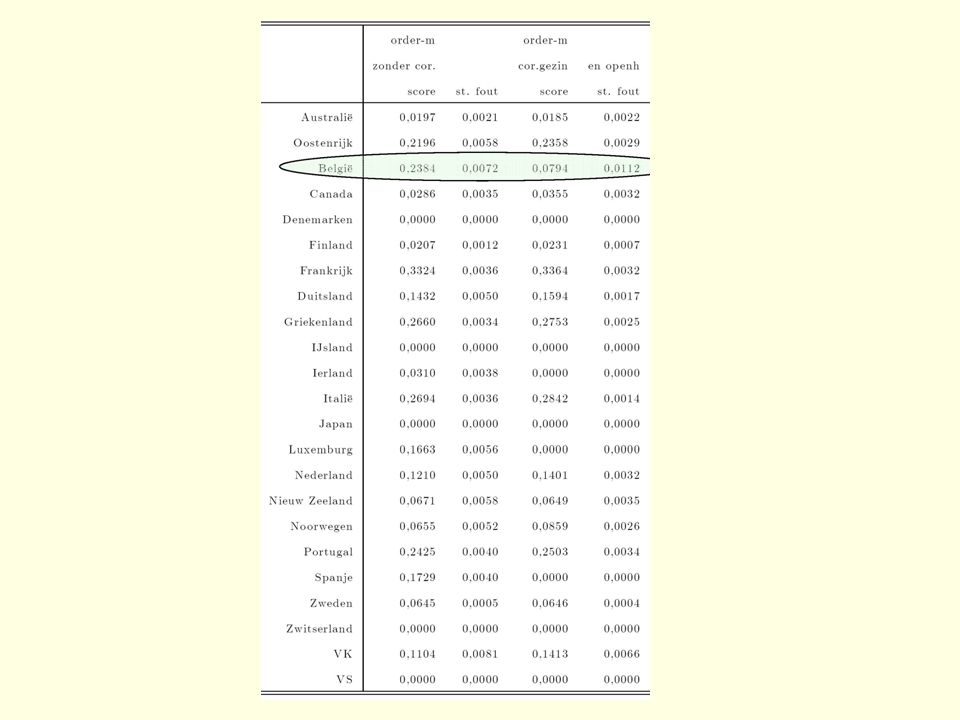
Non-parametric approach

44
Input Output FDH best practice frontier x o, y o A C B D E F G H

45
Budget size corrected for: - Small open economy (Dani Rodrick, 1998) - Small family size Non-parametric approach
 - Small family size Non-parametric approach")
47
The quality of government The quality of government is related to (correlation coefficient) - The strictness of the budgetary procedures0.66 (12 EU-countries) - The trust in other people0.62 (23 OECD-countries) - The trust of foreigners 0.89 (19 EU-countries)
 - The strictness of the budgetary procedures0.66 (12 EU-countries) - The trust in other people0.62 (23 OECD-countries) - The trust of foreigners 0.89 (19 EU-countries)")
48
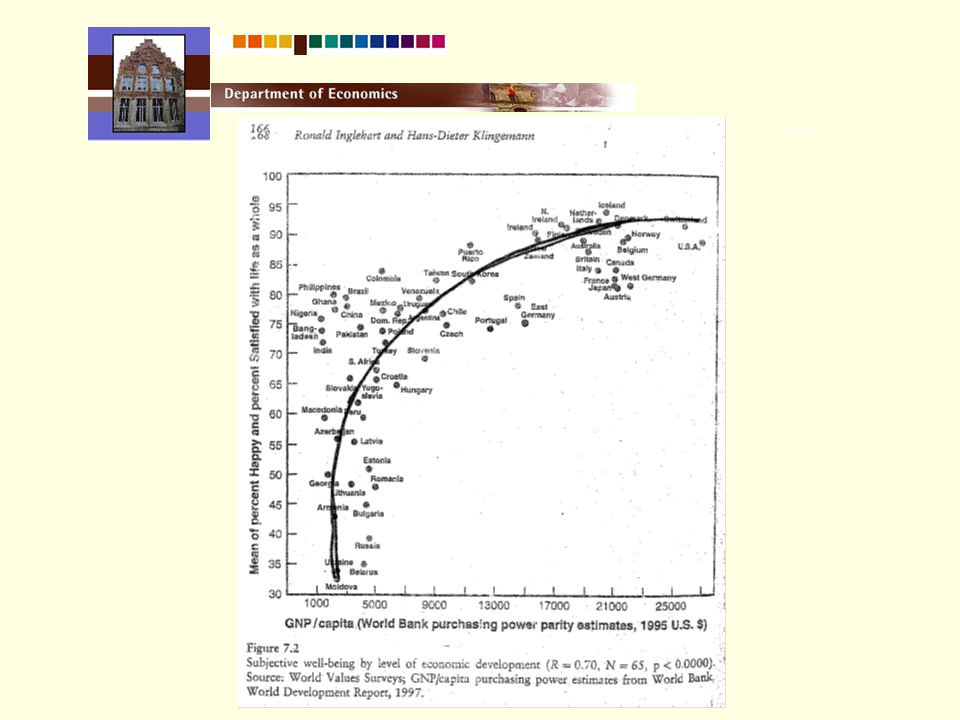
CONTENTS OF HAPPINESS Subjective well-being + personality characteristics + socio-demographic factors Human well-being + health + education GDP Economic welfare + employment + inflation Regrettables

50
LIFE SATISFACTION (1999-2000) RUUD VEENHOVEN, TILBURG UNIVERSITY CORRELATIONS WITH Control of corruption.85 Rule of law.85 Government effectiveness (World Bank).83 Political voice and accountability.78 Membership voluntary organisations.63 Health expenditures per capita.60 Trust in official institutions.55 Trust in people.54
 RUUD VEENHOVEN, TILBURG UNIVERSITY CORRELATIONS WITH Control of corruption.85 Rule of law.85 Government effectiveness (World Bank).83 Political voice and accountability.78 Membership voluntary organisations.63 Health expenditures per capita.60 Trust in official institutions.55 Trust in people.54")
Verwante presentaties
, de Vlaamse Gemeenschap, de Stad Antwerpen, OCMW.>")


