Download de presentatie
De presentatie wordt gedownload. Even geduld aub

2
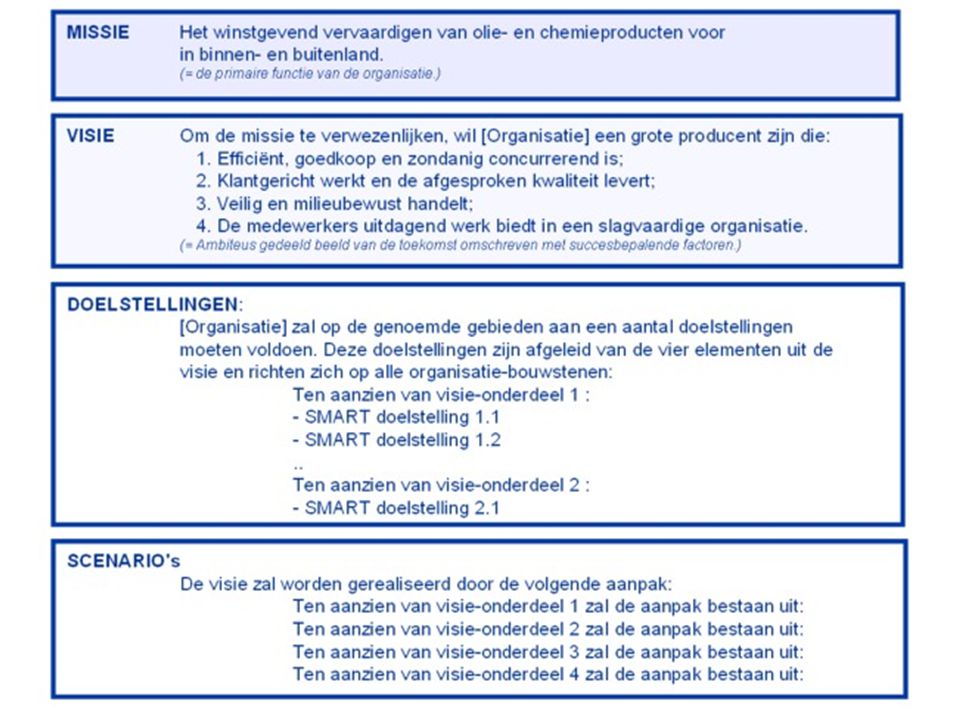
Mission: Enduring statement of purpose that identifies:
The scope of operations (product/ markets) Reflects values and priorities. Identifies key goals and values. It is the reason for being !!!
 Reflects values and priorities. Identifies key goals and values. It is the reason for being !!!")
3
Vision: Concise world picture of the organization at some time in future which sets the overall direction. It is what the organization strives to be. It is something to be pursued. (while a mission is something to be accomplished)
")
4
Strategy: Key success f. Key competence GAP constraints values
Capability to change

5
Product differentiatie
Product leiderschap “beste product” Leiderschap in Toegevoegde waarde Product differentiatie Operationele competentie Reactie snelheid Klant vertrouwen “best total solution” Operationele uitmuntendheid “best total cost”

7
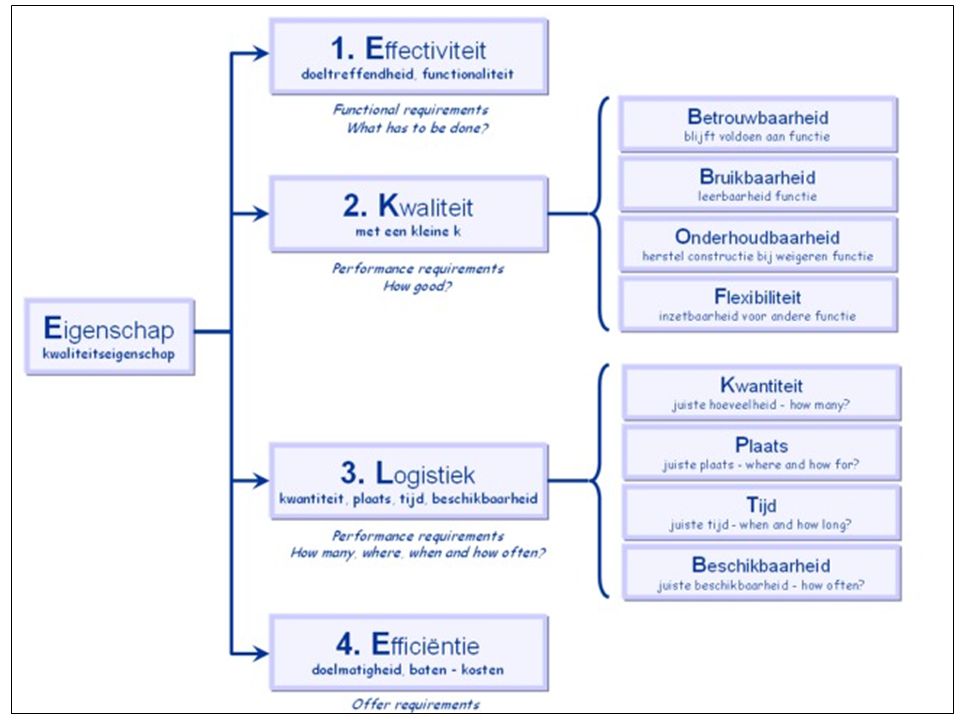
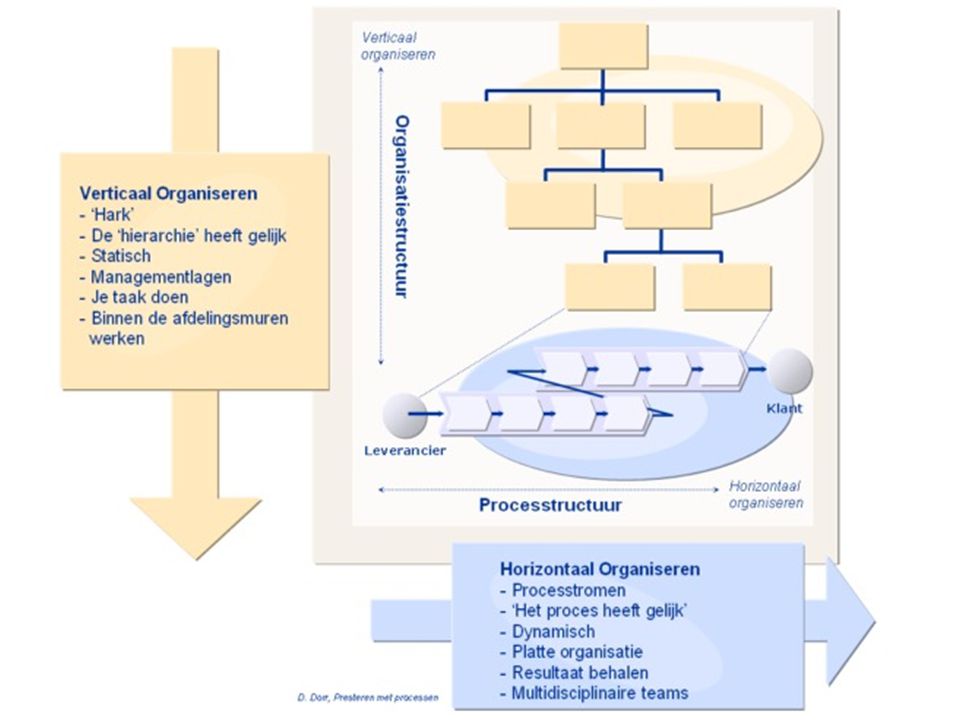
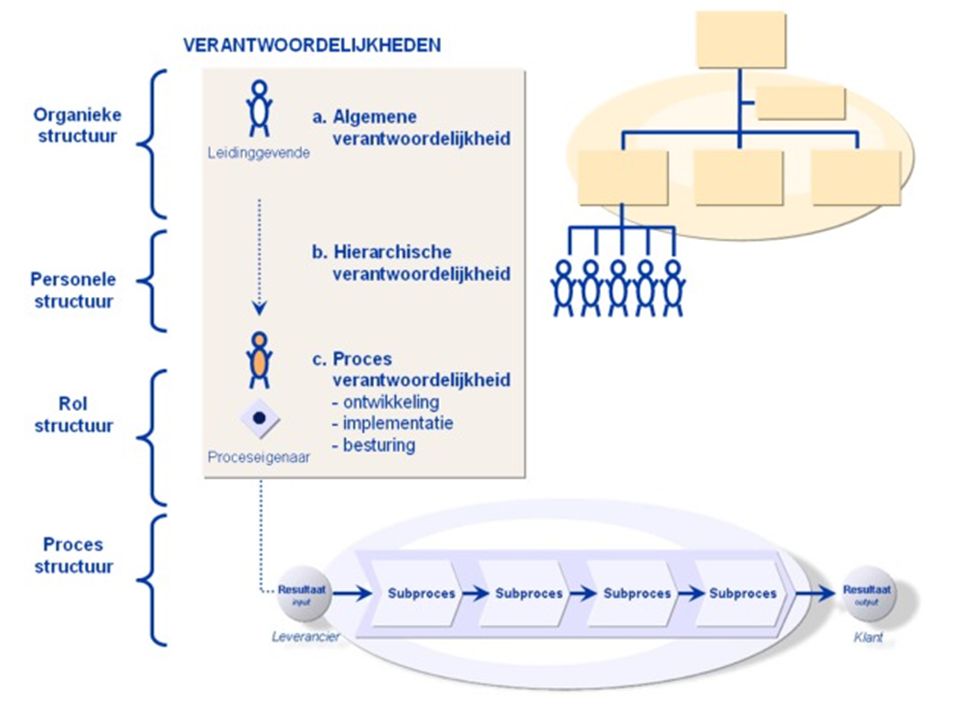
Definitie van processen:

8
Soorten processen:

11
BSC: succes factoren in evenwicht:
Klanten Perspectief: Wat zijn de key success factoren die de klant wenst? Financieel Perspectief: Wat bepaalt het Succes in de ogen Van onze share holders? Intern proces Perspectief: Wat is essentieel Voor onze primaire processen? Leervermogen als Perspectief: Wat zal toekomstige verbeteringen opbrengen?

12
5 Basics of quality: Definitie Q = doen wat de klant wil.
Meten: Q = geld Methode: Q = continu verbeteren Betrokkenheid: Q = iedereen is verantwoordelijk Doel: Q = tevreden stakeholders

13
Change When one of these is missing: Pressure For change A clear
Shared vision Capacity For change Actionable First steps Pressure For change A clear Shared vision Capacity For change Actionable First steps Low priority Little action Pressure For change A clear Shared vision Capacity For change Actionable First steps Fast start, Fizzles out Pressure For change A clear Shared vision Capacity For change Actionable First steps Anxiety frustration Haphazard Efforts, false starts Pressure For change A clear Shared vision Capacity For change Actionable First steps

14
QFD: Van visie naar aktie:

15
De 5 wetten van Lean Six sigma
Klanten zijn belangrijk Snelheid, kwaliteit en lage kosten staan in relatie met elkaar De methode is: Elimineren van variatie en defecten Richten op processtromen Beslissen op basis van gegevens Samenwerken om opvallende verbeteringen voor de klant te behalen

16
Examples from Manufacturing
Type of Waste Examples from Financial Services Scrap Rework Lost capacity due to mistakes Defects Errors and rework Work not meeting requirements Missing information Machine cycle time Equipment downtime Waiting for materials and tools Waiting time between batch processing Waiting Waiting for information, paperwork and approval Poorly functioning machinery Inadequate tools Equipment with unbalanced flow Processing Unnecessary steps Multiple handoffs Lack of standard procedures Repetitive and unnecessary movement of parts Poor ergonomic design causing people to make unnecessary movement Motion Walking to deliver paperwork Chasing needed information or data Lack of ergonomic workspace design Producing more than is required to meet customer demand Running machines and/or making parts to keep people and machines busy Overproduction Doing more than is needed Too many reports, reviews or approvals Batching paperwork High obsolescence and write-offs Producing what we can versus what the customer demands Inventory Excessive backlog or work to be processed Too much paper to be handled, processed, and filed Long travel distances Unplanned premium freight Large batch containers Transportation Paper-based versus electronic data transfer Inefficient interoffice mail systems Routing for unnecessary approvals and processing Limiting people to functional responsibilities Designating only certain people to perform certain jobs Limiting employees to exercise little judgment Workforce focused on very defined tasks that require a narrow range of skills Under Utilized People

17
Rolled Throughput Yield (RTY)
100 P1 P2 P3 P4 P5 P6 T 95 2 3 5 5 Yp2 = 0,98 Yp3 = 0,97 Yp6 = 0,95 Yt = 0,95 Rolled Throughput Yield = kans op het foutvrije produceren van een product RTY = 0,98 * 0,97 * 0,95 * 0,95 = 0,86

18
data collectie: standaard metingen die we nodig hebben om een VSM te maken: Cycle Time (C/T) Changeover Time (C/O) Uptime Defect Rate Er zijn nog veel meer metingen te bedenken afhankelijk van wat precies je wilt bereiken Refer to Lean Lexicon for definitions

19
Calculating Takt Time / 1 2 3 = TAKT TIME 420 75,600 1,250 20 62.5
Operating Time Number of Shifts per Day Daily Operating Time (A) min per shift X shift X 60 sec = sec per day 1 2 3 Monthly Requirements per Production Plan Number of Working Days in the Month Daily Requirement (B) = Units / Days Units per day Shifts per day TAKT TIME sec per unit 420 75,600 1,250 20 62.5 75,600 62.5 1209 20 min per unit
 min per shift X. shift X 60 sec = sec per day Monthly. Requirements per. Production Plan. Number of Working. Days in the Month. Daily Requirement (B) = Units. / Days. Units per day. Shifts per day. TAKT TIME. sec per unit ,600. 1, , min per unit.")
20
Current State VSM Cont. Dit is het critische pad:
9.2d m + 4.4d m d op dit pad t.o.v. 5.2 d + 6.5m + 1.1d + 5m + 2.6d voor het bovenste pad

21
Proces stap informatie:
After walking the floor the team has collected the following information for each process step Machine End (Parallel to Machine Body) Total Cycle Time (C/T) = 6.5 minutes Defect Rate: 4% Changeover Time (C/O) = 2.5 hours Uptime = 83% Operators = 1 Machine Body (Parallel to Machine End) Total Cycle Time (C/T) = 22.7 minutes Defect Rate: 2% Changeover Time (C/O) = 3 hours Uptime = 72% Wash End (Parallel to Wash Body) Total Cycle Time (C/T) = 5 minutes Defect Rate: 0% Changeover Time (C/O) = 0 minutes Uptime = 95% Batch Size = 50 Wash Body (Parallel to Wash End) Batch Size = 10 Assembly Total Cycle Time (C/T) = 12.5 minutes Defect Rate: 2% Changeover Time (C/O) = 15 minutes Uptime = 100% Operators = 1 Test Total Cycle Time (C/T) = 16 minutes Defect Rate: 0% Changeover Time (C/O) = 10 minutes Uptime = 78% Pack Total Cycle Time (C/T) = 2.1 minutes Changeover Time (C/O) = 0 minutes
 Total Cycle Time (C/T) = 6.5 minutes. Defect Rate: 4% Changeover Time (C/O) = 2.5 hours. Uptime = 83% Operators = 1. Machine Body (Parallel to Machine End) Total Cycle Time (C/T) = 22.7 minutes. Defect Rate: 2% Changeover Time (C/O) = 3 hours. Uptime = 72% Wash End (Parallel to Wash Body) Total Cycle Time (C/T) = 5 minutes. Defect Rate: 0% Changeover Time (C/O) = 0 minutes. Uptime = 95% Batch Size = 50. Wash Body (Parallel to Wash End) Batch Size = 10. Assembly. Total Cycle Time (C/T) = 12.5 minutes. Defect Rate: 2% Changeover Time (C/O) = 15 minutes. Uptime = 100% Operators = 1. Test. Total Cycle Time (C/T) = 16 minutes. Defect Rate: 0% Changeover Time (C/O) = 10 minutes. Uptime = 78% Pack. Total Cycle Time (C/T) = 2.1 minutes. Changeover Time (C/O) = 0 minutes.")
22
Proces Cyclus Efficientie
De Proces Cyclus Efficientie (Value Added Ratio), voor dit voorbeeld, is als volgt berekend: PCE: Value Add Time / Total Lead Time Value Add Time = 58.6 min Total Production Lead Time = 25 days 21 hours of available production per day x 60 minutes = 1260 available minutes per day. 1260 available minutes per day x 25 days = 31,520 minutes PCE: 58.6 min / 31,520 min = (.186%) PCE ratios varieren afhankelijkvan het proces. Manufacturing PCE’s zitten vaak tussen 1% and 4% Front Office PCE’s zitten vaak tussen 10% and 20%
, voor dit voorbeeld, is als volgt berekend: PCE: Value Add Time / Total Lead Time. Value Add Time = 58.6 min. Total Production Lead Time = 25 days. 21 hours of available production per day x 60 minutes = 1260 available minutes per day available minutes per day x 25 days = 31,520 minutes. PCE: 58.6 min / 31,520 min = (.186%) PCE ratios varieren afhankelijkvan het proces. Manufacturing PCE’s zitten vaak tussen 1% and 4% Front Office PCE’s zitten vaak tussen 10% and 20%")
23
Het kritische pad Wanneer je werkt met parallelle stappen kies dan de the stap met de grootste cyclustijd en productie lead time voor de zaagtand op de tijdlijn calculaties In dit voorbeeld is dat :Machine Body & Wash Body Op de tekening wordt dit aangegeven

24
Current State VSM!

25
VSM in 8 stappen: Maak de tekening mbv de symbolen die aangeven: de klant, leverancier en productie controle afdeling Teken een databox onder de klant en geef aan wat deze wenst per dag/ maand en hetaantal containers/ pallets per dag. Voeg toe: shipping & receiving informatie mbv pijlen die de materiaalflow geven Voeg de processtappen toe inclusief de databoxen (zelf data vergaren en niet uit spreadsheets.) Laat de toegevoegde waarde zienop de zaagtand. Laat de flow van informatie zien (forecasts, orders, etc.) tussen klant en leveranciers en tussen productiecontrol en manufacturing. Teken een voorraad teken daar waar tussenopslag wordt gehouden (voor en tussen processen). Geef de hoeveelheid WIP aan. Voeg de zaagtand toe met de tijdlijn/ cyclustijd en leverinformatie (gebruik het kritische pad). Calculeer en noteer de proces efficientie (PCE) door het delen van toegevoegde waarde tijd door Totale Productie Lead Time.
 Laat de toegevoegde waarde zienop de zaagtand. Laat de flow van informatie zien (forecasts, orders, etc.) tussen klant en leveranciers en tussen productiecontrol en manufacturing. Teken een voorraad teken daar waar tussenopslag wordt gehouden (voor en tussen processen). Geef de hoeveelheid WIP aan. Voeg de zaagtand toe met de tijdlijn/ cyclustijd en leverinformatie (gebruik het kritische pad). Calculeer en noteer de proces efficientie (PCE) door het delen van toegevoegde waarde tijd door Totale Productie Lead Time.")
Verwante presentaties


![Deltion College Engels C1 Gesprekken voeren [Edu/002]/ subvaardigheid lezen thema: Order, order…. can-do : kan een bijeenkomst voorzitten © Anne Beeker.](/8/2048322/big_thumb.jpg "Deltion College Engels C1 Gesprekken voeren [Edu/002]/ subvaardigheid lezen thema: Order, order…. can-do : kan een bijeenkomst voorzitten © Anne Beeker.>")


 Current Baseline (Version 6 – 27 Sept ’02) Endcap A/C.>")


