Download de presentatie
De presentatie wordt gedownload. Even geduld aub

1
M ARIO F. T RIOLA 3rd E DITION Essentials of S TATISTICS

2
Programma vandaag Organisatie en opzet van de cursus Waarom Statistiek? Vooruitblik op de stof hoofdstukken 1,2 en 3

3
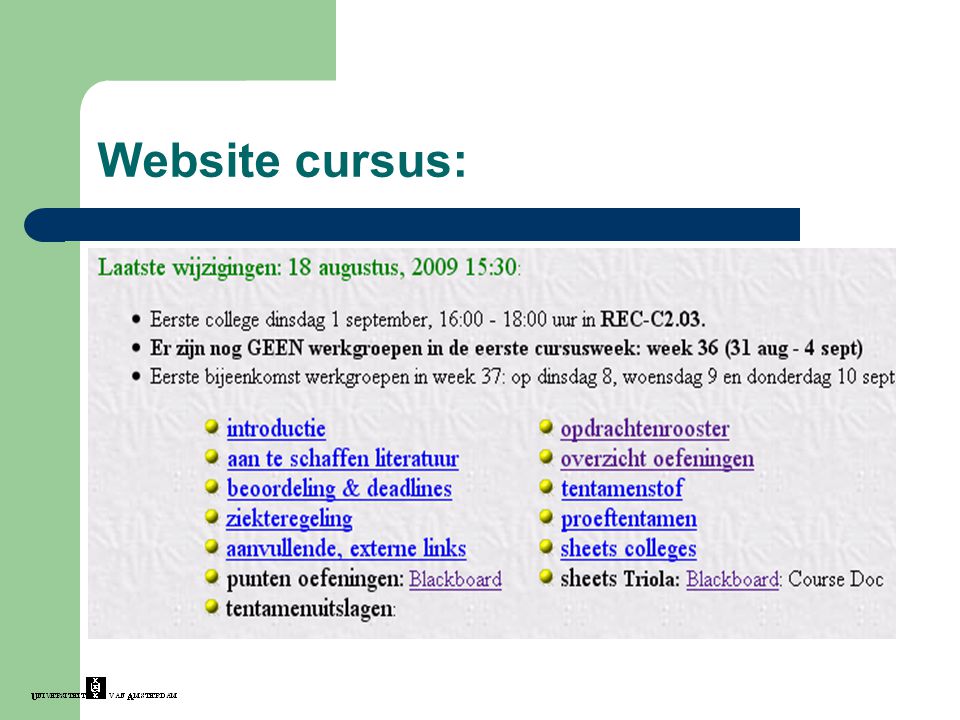
Website cursus:

5
Boek Literatuur: Mario Triola: Essentials of Statistics, 3 rd edition Addison-Wesley Higher Education, 2008

6
Rooster

8
Organisatie en opzet (1) Kijk zelf op website naar: – Introductie – Beoordeling en deadlines – Ziekteregeling – Rooster – Proeftentamen
 Kijk zelf op website naar: – Introductie – Beoordeling en deadlines – Ziekteregeling – Rooster – Proeftentamen")
9
Organisatie en opzet (2) Uitdelen en inleveren: – Week 1: uitdelen: opdrachten hoofdstuk 1, 2 en 3 – Week 2: inleveren: uitwerkingen hoofdstuk 1, 2 en 3 en Let op: maak een kopie voor de zelfbeoordeling bij de bespreking in de werkcolleges
 Uitdelen en inleveren: – Week 1: uitdelen: opdrachten hoofdstuk 1, 2 en 3 – Week 2: inleveren: uitwerkingen hoofdstuk 1, 2 en 3 en Let op: maak een kopie voor de zelfbeoordeling bij de bespreking in de werkcolleges")
10
Organisatie en opzet (3) Werkcolleges verplicht? Succes garantie?
 Werkcolleges verplicht Succes garantie")
11
Samenhang?

12
Waarom Statistiek? Lezen en schrijven artikelen vakgebied IK – Voorbeeld artikel MIS Quarterly Basisvoorwaarde: analytisch denken en redeneren – Voorbeeld: het Monty Hall-probleem Lezen en schrijven in het dagelijks leven – Voorbeeld: tabel actiecommitee in de buurt

13
Tabel (1) artikel MIS Quarterly
 artikel MIS Quarterly")
14
Tabel (2) artikel MIS Quarterly
 artikel MIS Quarterly")
15
Analytisch denken en redeneren Monty Hall probleem – Quiz: er zijn 3 gesloten deuren, – Achter één deur staat een auto, achter beide andere deuren is niets, – Jij mag een deur kiezen.. – Welke kans op de hoofdprijs?

16
Maar dan … De quizmaster opent NA UW KEUZE een van de twee overgebleven deuren en laat zien dat daar niets achter zit. Optie: U mag nu nog van gesloten deur wisselen. Vraag: verandert er bij wisseling iets aan de kans op de hoofdprijs?

17
Analyse Stel de hoofdprijs zit achter deur 1: 1. U koos deur 1 (auto). De quizmaster opent een andere deur waarachter niets staat. Ruilen levert verlies op… 2. U koos deur 2 (leeg). De quizmaster opent deur 3 waarachter niets staat. Ruilen levert hoofdprijs! 3. U koos deur 3 (leeg). De quizmaster opent deur 2 waarachter niets staat. Ruilen levert hoofdprijs! 123
. De quizmaster opent deur 3 waarachter niets staat. Ruilen levert hoofdprijs. 3. U koos deur 3 (leeg). De quizmaster opent deur 2 waarachter niets staat. Ruilen levert hoofdprijs")
18
http://www.kennislink.nl/publicaties/ho mmeles-over-drie-deuren

19
Tabel buurtcomité

20
Aanpak colleges Géén traditionele hoorcolleges met uitgebreide uitleg, waarom niet? Wel: vragenuur en bespreking van mogelijke knelpunten, op verzoek vooruitblik op de stof Nu: hoofdpunten hoofdstuk 1, 2 en 3

21
Sekties hfst 1, 2 en 3 1.1 Overzicht 1.2 Datatypen 1.3 Kritisch denken 1.4 Ontwerp experimenten 2.1 Overzicht 2.2 Frequentieverdeling 2.3 Histogrammen 2.4 Grafische weergave 3.1 Overzicht 3.2 Centrummaten 3.3 Variatiematen 3.4 Relatieve afwijking 3.5 Exploratieve data- analyse

22
Triola, hoofdstuk 1 Belangrijke definities voor gebruik bij de statistiek

23
Sektie 1.1 Belangrijke definities Data Statistiek Populatie Census Steekproef

24
Definitie Statistiek a collection of methods for - planning studies and experiments, - obtaining data, - and then organizing, summarizing, presenting, analyzing, interpreting, - and drawing conclusions based on the data

25
Chapter Key Concepts Sample data must be collected in an appropriate way, such as through a process of random selection. If sample data are not collected in an appropriate way, the data may be so completely useless that no amount of statistical torturing can salvage them.

26
Sektie 1.2 Data typen Definities: – Populatie parameter versus steekproef statistic – Kwantitatieve versus kwalitatieve data – Discrete versus continue data – Meetnivo’s: nominaal, ordinaal, interval, ratio

27
Levels of Measurement 1. Nominal - categories only 2. Ordinal - categories with some order 3. Interval - differences but no natural starting point 4. Ratio - differences and a natural starting point

28
Sektie 1.3 Kritisch denken Misbruik, ondeskundig gebruik, verkeerd gebruik van de statistiek

29
Misuse # 1- Bad Samples Voluntary response sample (or self-selected sample) - one in which the respondents themselves decide whether to be included. In this case, valid conclusions can be made only about the specific group of people who agree to participate.

30
Loaded Questions Order of Questions Refusals Correlation & Causality Self Interest Study Precise Numbers Partial Pictures Deliberate Distortions Other Misuses of Statistics

31
To correctly interpret a graph, you must analyze the numerical information given in the graph, so as not to be misled by the graph’s shape. Misuse - Graphs

32
Sektie 1.4 Ontwerp van het onderzoek Soorten studies – Observationeel – Experimenteel – Retrospectief – Prospectief (longitudinaal, cohort)
")
33
Confounding occurs in an experiment when the experimenter is not able to distinguish between the effects of different factors Definition

34
Voorbeeld: confounding effects

35
Controlling Effects of Variables Blinding – subject does not know he or she is receiving a treatment or placebo Rigorously Controlled Design – subjects are very carefully chosen Blocks – groups of subjects with similar characteristics Completely Randomized Exp. Design – subjects are put into blocks through a process of random selection

36
Steekproeven

37
Definitions Random Sample – members of the population are selected in such a way that each individual member has an equal chance of being selected Simple Random Sample (of size n) – subjects selected in such a way that every possible sample of the same size n has the same chance of being chosen
 – subjects selected in such a way that every possible sample of the same size n has the same chance of being chosen")
38
Triola, hoofdstuk 2 Statistiek voor het samenvatten en weergeven van data

39
1. Center: A representative or average value that indicates where the middle of the data set is located. 2. Variation: A measure of the amount that the values vary among themselves. 3. Distribution: The nature or shape of the distribution of data (such as bell-shaped, uniform, or skewed). 4. Outliers: Sample values that lie very far away from the vast majority of other sample values. 5. Time: Changing characteristics of the data over time. Sektie 2.1 Overview Important Characteristics of Data CVDOT
. 4. Outliers: Sample values that lie very far away from the vast majority of other sample values. 5. Time: Changing characteristics of the data over time. Sektie 2.1 Overview Important Characteristics of Data CVDOT.")
40
Sektie 2.2 Frequentieverdelingen Gewone (rechte) telling van waarden in een tabel Samenvoegen van waarden in categorieën (classes)
 telling van waarden in een tabel Samenvoegen van waarden in categorieën (classes)")
41
Frequency Distribution Ages of Best Actresses Frequency Distribution Original Data

42
Frequency Tables

43
Sektie 2.3 Histogrammen Grafische weergave van verdelingen

44
Histogram A bar graph in which the horizontal scale represents the classes of data values and the vertical scale represents the frequencies

45
Relative Frequency Histogram Has the same shape and horizontal scale as a histogram, but the vertical scale is marked with relative frequencies instead of actual frequencies

46
One key characteristic of a normal distribution is that it has a “bell” shape. The histogram below illustrates this. Critical Thinking Interpreting Histograms

47
Sektie 2.4 Statistical graphics Andere vormen van visuele weergave – Polygon – Ogive – Dot plot – Stemplot – Pareto chart – Pie chart – Scatter plot – Time series

48
Pie chart

49
Triola, hoofdstuk 3 Statistiek voor het beschrijven, verkennen en vergelijken van data

50
Sektie 3.1 Overzicht Descriptive Statistics – summarize or describe the important characteristics of a known set of data Inferential Statistics – use sample data to make inferences (or generalizations) about a population
 about a population")
51
Sektie 3.2 Centrummaten Gemiddelde (mean) – van steekproef (x-streep) – van populatie (mu) Mediaan (x-tilde) Modus Midrange Gewogen gemiddelde
 – van steekproef (x-streep) – van populatie (mu) Mediaan (x-tilde) Modus Midrange Gewogen gemiddelde")
52
Notation µ is pronounced ‘mu’ and denotes the mean of all values in a population x = n x x is pronounced ‘x- bar’ and denotes the mean of a set of sample values N µ = x x

53
use class midpoint of classes for variable x Mean from a Frequency Distribution

54
Best Measure of Center

55
Sektie 3.3 Variatiematen Range Standaard deviatie – steekproef (s) en populatie (sigma) Variantie (s-kwadraat) Variatiecoëfficiënt (CV)
 en populatie (sigma) Variantie (s-kwadraat) Variatiecoëfficiënt (CV)")
56
Key Concept Because this section introduces the concept of variation, which is something so important in statistics, this is one of the most important sections in the entire book. Place a high priority on how to interpret values of standard deviation.

57
Definition The standard deviation of a set of sample values is a measure of variation of values about the mean.

58
Sample Standard Deviation Formula ( x - x ) 2 n - 1 s =s =
 2 n - 1 s =s =")
59
Population Standard Deviation 2 ( x - µ ) N = This formula is similar to the previous formula, but instead, the population mean and population size are used.
 N = This formula is similar to the previous formula, but instead, the population mean and population size are used.")
60
Standard Deviation - Important Properties The standard deviation is a measure of variation of all values from the mean. The value of the standard deviation s can increase dramatically with the inclusion of one or more outliers (data values far away from all others). The units of the standard deviation s are the same as the units of the original data values.
. The units of the standard deviation s are the same as the units of the original data values..")
61
Estimation of Standard Deviation Range Rule of Thumb For interpreting a known value of the standard deviation s, find rough estimates of the minimum and maximum “usual” sample values by using: Minimum “usual” value (mean) – 2 X (standard deviation) = Maximum “usual” value (mean) + 2 X (standard deviation) =
 – 2 X (standard deviation) = Maximum usual value (mean) + 2 X (standard deviation) =")
62
The Empirical Rule

63
Sektie 3.4 Maten van relatieve afwijking Z-scores Quartielen Percentielen

64
z Score (or standardized value) the number of standard deviations that a given value x is above or below the mean Definition
 the number of standard deviations that a given value x is above or below the mean Definition")
65
Sample Population x - µ z = Round z to 2 decimal places Measures of Position z score z = x - x s

66
Interpreting Z Scores Whenever a value is less than the mean, its corresponding z score is negative Ordinary values: z score between –2 and 2 Unusual Values:z score 2

67
Sektie 3.5 EDA Uitbijters (outliers) Boxplot
 Boxplot")
68
Important Principles An outlier can have a dramatic effect on the mean. An outlier can have a dramatic effect on the standard deviation. An outlier can have a dramatic effect on the scale of the histogram so that the true nature of the distribution is totally obscured.

69
Boxplots

70
Boxplots - cont

71
Einde hoofdpunten 1, 2 en 3 Volgende week dinsdag: – Vragenuur hoofdstukken 1, 2 en 3 Alleen zinvol voor woe en do werkgroep – Hoofdpunten hoofdstukken 4 en 5 Naar behoefte – Vragenuur hoofdstukken 4 en 5 Zinvol als je vooruit leest

Verwante presentaties
![Deltion College Engels C1 Spreken [Edu/003] thema “Oprah at Deltion” can-do : kan duidelijke, gedetailleerde beschrijving geven van complexe onderwerpen,](/8/2033280/big_thumb.jpg "Deltion College Engels C1 Spreken [Edu/003] thema “Oprah at Deltion” can-do : kan duidelijke, gedetailleerde beschrijving geven van complexe onderwerpen,>")


![Deltion College Engels C1 Gesprekken voeren [Edu/002]/ subvaardigheid lezen thema: Order, order…. can-do : kan een bijeenkomst voorzitten © Anne Beeker.](/8/2048322/big_thumb.jpg "Deltion College Engels C1 Gesprekken voeren [Edu/002]/ subvaardigheid lezen thema: Order, order…. can-do : kan een bijeenkomst voorzitten © Anne Beeker.>")


