Download de presentatie
De presentatie wordt gedownload. Even geduld aub

1
Non-Hodgkin lymfoom Mark-David Levin

3
Hemato-poiese Normaal Kaushansky K. N Engl J Med 2006;354:

4
Lymfomen 85% 15% Non-Hodgkin lymfoom Hodgkin lymfoom
Kaushansky K. N Engl J Med 2006;354:

5
NOOIT DIAGNOSE OP PUNCTIE, ALTIJD BIOPT!!
Lymfomen Non-Hodgkin lymfoom 85% NOOIT DIAGNOSE OP PUNCTIE, ALTIJD BIOPT!! Hodgkin lymfoom 15% Kaushansky K. N Engl J Med 2006;354:

7
Hemato-poiese Normale lymfklier

8
Hemato-poiese Normale lymfklier Diffuus Grootcellig NHL

9
BM-morfologie

10
BM-immuno

11
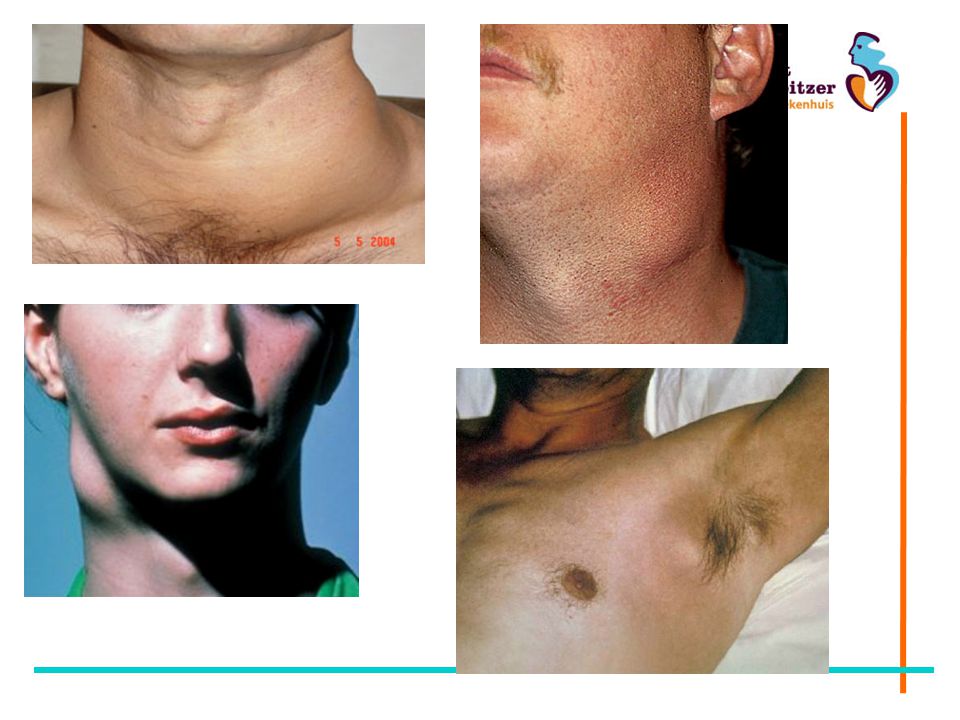
Non-Hodgkin lymfoom - biopt

12
Cytogenetica (FISH)
")
13
Intermediair NHL - IPI IPI Age adjusted IPI (aaIPI)
Ship. A predictive model for aggressive Non-Hodgkin’s lymphoma NEJM 1993; 329: 987

14
Intermediair NHL - Age adjusted IPI
Plateau!

15
Intermediair NHL - therapie (1999)
1e lijn: 8 x CHOP elke 3 weken genezingskans 50% Bij recidief: 3 x DHAP (klinisch 5 dagen) Autologe stamceltransplantatie na BEAM Genezingskans 25% (grote selectie!)
 Autologe stamceltransplantatie na BEAM. Genezingskans 25% (grote selectie!)")
16
Intermediar NHL - Rituximab
Antistof gericht tegen CD20 = antigeen op alle B-cellen Monotherapie slechts tijdelijke respons Kosten Euro per kuur per patient Bijwerking: koorts / rilling tijdens infusie

17
Rituximab bij jongeren met intermediar NHL
823 patienten met DLBC-NHL < 65 jaar chemo +/- Rituximab Pfreundschuh M. CHOP-like chemotherapy plus rituximab versus CHOP-like chemotherapy alone in young patients with good-prognosis diffuse large-B-cell lymphoma: a randomised controlled trial ... Lancet Oncol May;7(5):379-91
:")
18
Rituximab bij ouderen met intermediar NHL
399 patienten met DLBC-NHL > 65 jaar Event-free survival Coiffier B. CHOP chemotherapy plus rituximab compared with CHOP alone in elderly patients with diffuse large-B-cell lymphoma. N Engl J Med Jan 24;346(4):
:")
19
Rituximab bij ouderen met intermediar NHL
Overleving

20
Microarray

21
DLBC-NHL: Gen-expressie profiel
Figure 1. Subgroups of Diffuse Large-B-Cell Lymphoma According to Gene-Expression Profiles. Panel A shows the hierarchical clustering of diffuse large-B-cell lymphomas from 240 patients with untreated disease and 34 patients who had previously been treated or who had a preexisting low-grade lymphoma, according to the level of expression of 100 genes. Red areas indicate increased expression, and green areas decreased expression. Each column represents a single diffuse large-B-cell lymphoma, and each row represents a single gene. Genes that are characteristically expressed in germinal-center B-cell-like diffuse large-B-cell lymphomas or activated B-cell-like diffuse large-B-cell lymphomas are indicated. The dendrogram at the top shows the degree to which each diffuse large-B-cell lymphoma is related to the others with respect to gene expression. Panel B shows the number of samples with amplification of the c-rel locus and bcl-2 translocations in subgroups of diffuse large-B-cell lymphoma. The ratio of genomic copy number for the c-rel and {beta}2-microglobulin loci was determined by a quantitative polymerase-chain-reaction assay, and ratios greater than 2 were considered to indicate c-rel amplification. The bcl-2 translocations were detected with the use of a polymerase-chain-reaction assay for the main break-point cluster region that is frequently involved in the t(14;18) translocation. Data are from patients who had untreated diffuse large-B-cell lymphomas without preexisting cancer. Panel C shows Kaplan-Meier estimates of overall survival after chemotherapy among the 240 previously untreated patients, according to the gene-expression subgroup. Rosenwald A et al. N Engl J Med 2002;346:
 translocation. Data are from patients who had untreated diffuse large-B-cell lymphomas without preexisting cancer. Panel C shows Kaplan-Meier estimates of overall survival after chemotherapy among the 240 previously untreated patients, according to the gene-expression subgroup. Rosenwald A et al. N Engl J Med 2002;346:")
22
Gen-expressie profiel DLBC-NHL
Figure 1. Subgroups of Diffuse Large-B-Cell Lymphoma According to Gene-Expression Profiles. Panel A shows the hierarchical clustering of diffuse large-B-cell lymphomas from 240 patients with untreated disease and 34 patients who had previously been treated or who had a preexisting low-grade lymphoma, according to the level of expression of 100 genes. Red areas indicate increased expression, and green areas decreased expression. Each column represents a single diffuse large-B-cell lymphoma, and each row represents a single gene. Genes that are characteristically expressed in germinal-center B-cell-like diffuse large-B-cell lymphomas or activated B-cell-like diffuse large-B-cell lymphomas are indicated. The dendrogram at the top shows the degree to which each diffuse large-B-cell lymphoma is related to the others with respect to gene expression. Panel B shows the number of samples with amplification of the c-rel locus and bcl-2 translocations in subgroups of diffuse large-B-cell lymphoma. The ratio of genomic copy number for the c-rel and {beta}2-microglobulin loci was determined by a quantitative polymerase-chain-reaction assay, and ratios greater than 2 were considered to indicate c-rel amplification. The bcl-2 translocations were detected with the use of a polymerase-chain-reaction assay for the main break-point cluster region that is frequently involved in the t(14;18) translocation. Data are from patients who had untreated diffuse large-B-cell lymphomas without preexisting cancer. Panel C shows Kaplan-Meier estimates of overall survival after chemotherapy among the 240 previously untreated patients, according to the gene-expression subgroup. Rosenwald A et al. N Engl J Med 2002;346:
 translocation. Data are from patients who had untreated diffuse large-B-cell lymphomas without preexisting cancer. Panel C shows Kaplan-Meier estimates of overall survival after chemotherapy among the 240 previously untreated patients, according to the gene-expression subgroup. Rosenwald A et al. N Engl J Med 2002;346:")
23
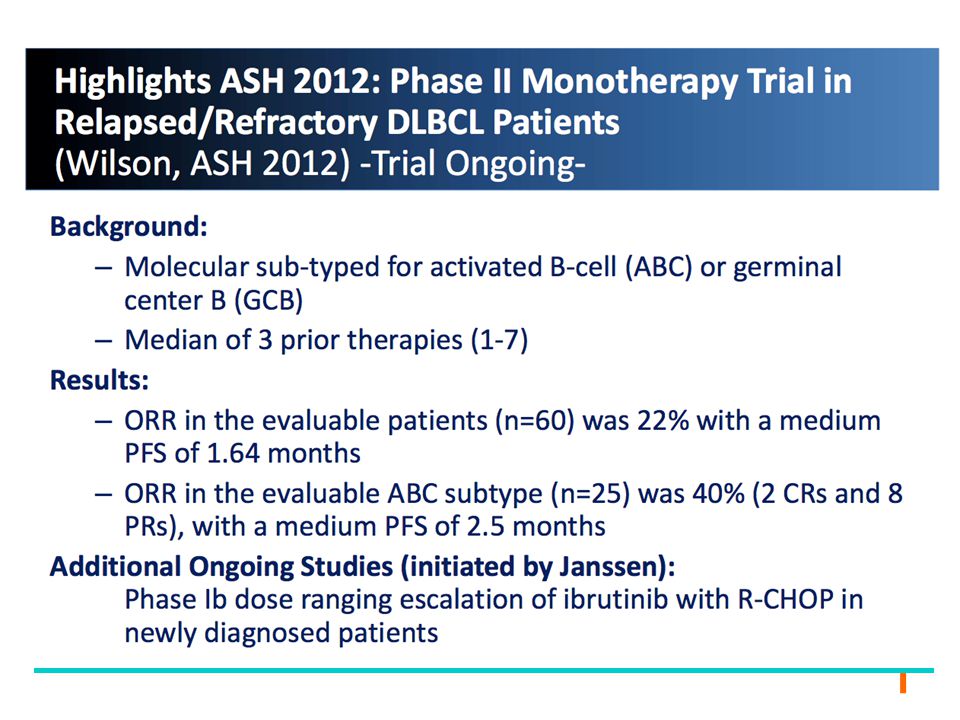
Brutons kinase

24
Brutons kinase Ibrutinib

26
Gen-expressie profiel DLBC-NHL
Figure 1. Subgroups of Diffuse Large-B-Cell Lymphoma According to Gene-Expression Profiles. Panel A shows the hierarchical clustering of diffuse large-B-cell lymphomas from 240 patients with untreated disease and 34 patients who had previously been treated or who had a preexisting low-grade lymphoma, according to the level of expression of 100 genes. Red areas indicate increased expression, and green areas decreased expression. Each column represents a single diffuse large-B-cell lymphoma, and each row represents a single gene. Genes that are characteristically expressed in germinal-center B-cell-like diffuse large-B-cell lymphomas or activated B-cell-like diffuse large-B-cell lymphomas are indicated. The dendrogram at the top shows the degree to which each diffuse large-B-cell lymphoma is related to the others with respect to gene expression. Panel B shows the number of samples with amplification of the c-rel locus and bcl-2 translocations in subgroups of diffuse large-B-cell lymphoma. The ratio of genomic copy number for the c-rel and {beta}2-microglobulin loci was determined by a quantitative polymerase-chain-reaction assay, and ratios greater than 2 were considered to indicate c-rel amplification. The bcl-2 translocations were detected with the use of a polymerase-chain-reaction assay for the main break-point cluster region that is frequently involved in the t(14;18) translocation. Data are from patients who had untreated diffuse large-B-cell lymphomas without preexisting cancer. Panel C shows Kaplan-Meier estimates of overall survival after chemotherapy among the 240 previously untreated patients, according to the gene-expression subgroup. R-CHOP-21 R-CHOP-21 + Ibrutinib
 translocation. Data are from patients who had untreated diffuse large-B-cell lymphomas without preexisting cancer. Panel C shows Kaplan-Meier estimates of overall survival after chemotherapy among the 240 previously untreated patients, according to the gene-expression subgroup. R-CHOP-21. R-CHOP Ibrutinib.")
27
Intermediar NHL Stadium 1: 3 x R-CHOP-21 + IN-RTX
Stadium 2-4 Germinal-center type: R-CHOP intraveneus vs subcutaan (MabEase) Stadium 2-4 non-Germinal center type: R-CHOP-21 vs R-CHOP-21 + Ibrutinib Figure 2. Development of the Six-Gene Model. Panel A shows Kaplan-Meier estimates of overall survival in the 66 patients with diffuse large-B-cell lymphoma, analyzed by quantitative reverse-transcriptase polymerase chain reaction with TaqMan probe-based assays. The dotted lines represent 95 percent confidence intervals. Panel B shows Kaplan-Meier curves for overall survival in the three groups (at low, medium, and high risk of death) as defined by a prediction model based on the weighted expression of six genes (LMO2, BCL6, FN1, CCND2, SCYA3, and BCL2). According to log-likelihood estimates, P=0.001 for the model based on a continuous variable, and P=0.02 for the model based on the three discrete groups shown in the figure.
 Stadium 2-4 non-Germinal center type: R-CHOP-21 vs R-CHOP-21 + Ibrutinib. Figure 2. Development of the Six-Gene Model. Panel A shows Kaplan-Meier estimates of overall survival in the 66 patients with diffuse large-B-cell lymphoma, analyzed by quantitative reverse-transcriptase polymerase chain reaction with TaqMan probe-based assays. The dotted lines represent 95 percent confidence intervals. Panel B shows Kaplan-Meier curves for overall survival in the three groups (at low, medium, and high risk of death) as defined by a prediction model based on the weighted expression of six genes (LMO2, BCL6, FN1, CCND2, SCYA3, and BCL2). According to log-likelihood estimates, P=0.001 for the model based on a continuous variable, and P=0.02 for the model based on the three discrete groups shown in the figure.")
28
Non-Hodgkin lymfoom Vragen?

Verwante presentaties


>")


>")


>")


