Download de presentatie
De presentatie wordt gedownload. Even geduld aub

1
ECG interpretation for beginners – 2 Axel en Luc De Wolf RZ Tienen UZ Leuven

3
INFLUENCE OF TIME-TO-TREATMENT ON THE ODDS RATIO (OR) OF MORTALITY
3 INFLUENCE OF TIME-TO-TREATMENT ON THE ODDS RATIO (OR) OF MORTALITY 80 The “golden hour”: 65 lives are saved for every 1,000 patients treated when the treatment is initiated within the first hour of symptom onset! PATHOPHYSIOLOGY + EPIDEMIOLOGY THROMBOLYSIS IN CLINICAL TRIALS AND REGISTRIES NEW TRIALS/ REGISTRIES MANAGEMENT OF ACUTE MI AND THE RATIONALE FOR EARLY REPERFUSION CLINICAL QUESTIONS METALYSE (+ PRESCRIBING INFORMATION) COSTS REFERENCES SYSTEM REQUIREMENTS IMPRESSUM 60 ABSOLUTE BENEFIT PER 1,000 TREATED PATIENTS 40 20 TIME-TO-TREATMENT AND MORTALITY REDUCTION ARE RELATED The amount of tissue salvageable in myocardial infarction is inversely related to the duration of coronary artery occlusion up to about 5 hours, when myocardial ischaemia becomes irreversible. Very substantial myocardial salvage, and therefore saving of life, is possible if reperfusion therapy is started within 2 hours of the onset of symptoms, and especially within the first “golden” hour. During the first 2–3 hours after symptom onset, time to treatment is a critical determinant of the extent of salvage and reduction in mortality. Subsequently, a benefit persists but the ‘flattening of the curve’ emphasises that time to treatment is less of a factor and the major priority is opening of the infarct-related artery. 3 6 9 12 15 18 21 24 TREATMENT DELAY IN HOURS Boersma et al. Lancet 1996; 348: 771–775. 3 3
 OF MORTALITY. 80. The golden hour : 65 lives are saved for every 1,000 patients treated when the treatment is initiated within the first hour of symptom onset! PATHOPHYSIOLOGY + EPIDEMIOLOGY. THROMBOLYSIS IN CLINICAL TRIALS AND REGISTRIES. NEW TRIALS/ REGISTRIES. MANAGEMENT OF ACUTE MI AND THE RATIONALE FOR EARLY REPERFUSION. CLINICAL QUESTIONS. METALYSE (+ PRESCRIBING INFORMATION) COSTS. REFERENCES. SYSTEM REQUIREMENTS. IMPRESSUM. 60. ABSOLUTE BENEFIT PER 1,000 TREATED PATIENTS TIME-TO-TREATMENT AND MORTALITY REDUCTION ARE RELATED. The amount of tissue salvageable in myocardial infarction is inversely related to the duration of coronary artery occlusion up to about 5 hours, when myocardial ischaemia becomes irreversible. Very substantial myocardial salvage, and therefore saving of life, is possible if reperfusion therapy is started within 2 hours of the onset of symptoms, and especially within the first golden hour. During the first 2–3 hours after symptom onset, time to treatment is a critical determinant of the extent of salvage and reduction in mortality. Subsequently, a benefit persists but the ‘flattening of the curve’ emphasises that time to treatment is less of a factor and the major priority is opening of the infarct-related artery TREATMENT DELAY IN HOURS. Boersma et al. Lancet 1996; 348: 771–")
4
A heart Blood circulates, passing near every cell in the body, driven by this pump …actually, two pumps… Atria = turbochargers Myocardium = muscle Mechanical systole Electrical systole

5
Excitation of the Heart

6
Excitation of the Heart

7
Cardiac Electrical Activity

8
A system Quality of ECG? Rate Rhythm Axis P wave PR interval
QRS duration QRS morphology Abnormal Q waves ST segment T wave QT interval

9
A system Quality of ECG? Rate Rhythm Axis P wave PR interval
QRS duration QRS morphology Abnormal Q waves ST segment T wave QT interval

10
P wave Are there P waves….? Not very accurate or useful….
Pointy = P pulmonale (RA hypertrophy)>2,5mm Bifid = P mitrale (LA hypertrophy)>2,5mm Not very accurate or useful….
>2,5mm. Bifid = P mitrale (LA hypertrophy)>2,5mm. Not very accurate or useful….")
11
PR interval Start of P wave to start of QRS Normal = 0.12-0.2s
Too short – can mean WPW syndrome (ie. an accessory pathway), or normal! Too long –means AV block (heart block) - 1st/2nd/3rd degree
, or normal! Too long –means AV block (heart block) - 1st/2nd/3rd degree.")
12
A system Quality of ECG? Rate Rhythm Axis P wave PR interval
QRS duration QRS morphology Abnormal Q waves ST segment T wave QT interval

13
QRS complex Should be <0.12s duration
>0.12s = BBB (either LBBB or RBBB) ‘Pathological’ Q waves can mean a previous MI (? territory) >25% size of subsequent complex Q waves are allowed in V1, aVR and III
 ‘Pathological’ Q waves can mean a previous MI ( territory) >25% size of subsequent complex. Q waves are allowed in V1, aVR and III.")
14
BBB Look at V1 and V6 W I LL ia M = LBBB M a RR o W = RBBB

15
QRS complex Is there LVH?
Sum of the Q or S wave in V1 and the biggest R wave in V5 or V6 >35mm (R wave in aVL >11mm) Not actually very useful….
 Not actually very useful….")
16
A system Quality of ECG? Rate Rhythm Axis P wave PR interval
QRS duration QRS morphology Abnormal Q waves ST segment T wave QT interval

17
ST segment ST depression ST elevation
Downsloping or horizontal = abnormal Ischaemia (coronary stenosis) If lateral (V4-V6), consider LVH with ‘strain’ or digoxin (reverse tick sign) ST elevation Infarction (coronary occlusion) Pericarditis (widespread) These are usually in ‘territories’ eg. anterior/lateral/inferior etc. and will be present in contiguous leads
 If lateral (V4-V6), consider LVH with ‘strain’ or digoxin (reverse tick sign) ST elevation. Infarction (coronary occlusion) Pericarditis (widespread) These are usually in ‘territories’ eg. anterior/lateral/inferior etc. and will be present in contiguous leads.")
21
T wave Peaked (hyperkalaemia or normal young man)
Inverted/biphasic (ischaemia, previous infarct) Small (hypokalaemia) No pot, no tea!
 Small (hypokalaemia) No pot, no tea!")
24
QT interval Don’t worry about too much… Start of QRS to end of T wave
Needs to be corrected for HR Various formulae eg. Bazett’s: Computer calculated often wrong Long QT can be genetic (long QT sy.) or secondary eg. drugs (amiodarone, sotalol) Associated with risk of sudden death due to Torsades de Pointes
 or secondary eg. drugs (amiodarone, sotalol) Associated with risk of sudden death due to Torsades de Pointes.")
25
Morfologische afwijkingen Hypertrofie Voorkamer en Kamer

26
K51 – Rechter voorkamerhypertrofie
Dilatatie van de rechter voorkamer Hoge spitse P toppen in afl. II & aVF ( 0,25 mV) Toename initiële P voltage in afl. II, III, aVF & V1 Normale duur P golf Vaak in combinatie met tekenen van rechter kamerhypertrofie P pulmonale
 Toename initiële P voltage in afl. II, III, aVF & V1. Normale duur P golf. Vaak in combinatie met tekenen van rechter kamerhypertrofie. P pulmonale.")
27
K52 - Linker voorkamerhypertrofie
Dilatatie van de linker voorkamer P golf > 120 ms Gehaakte P top door toename amplitude terminaal deel van P golf in afl. I, II, aVL & V6 Bifasische P golf in afl. V1 met terminaal negatief deel ( 0,1 mV, 40 ms) Risico op atriale fibrillatie
 Risico op atriale fibrillatie.")
28
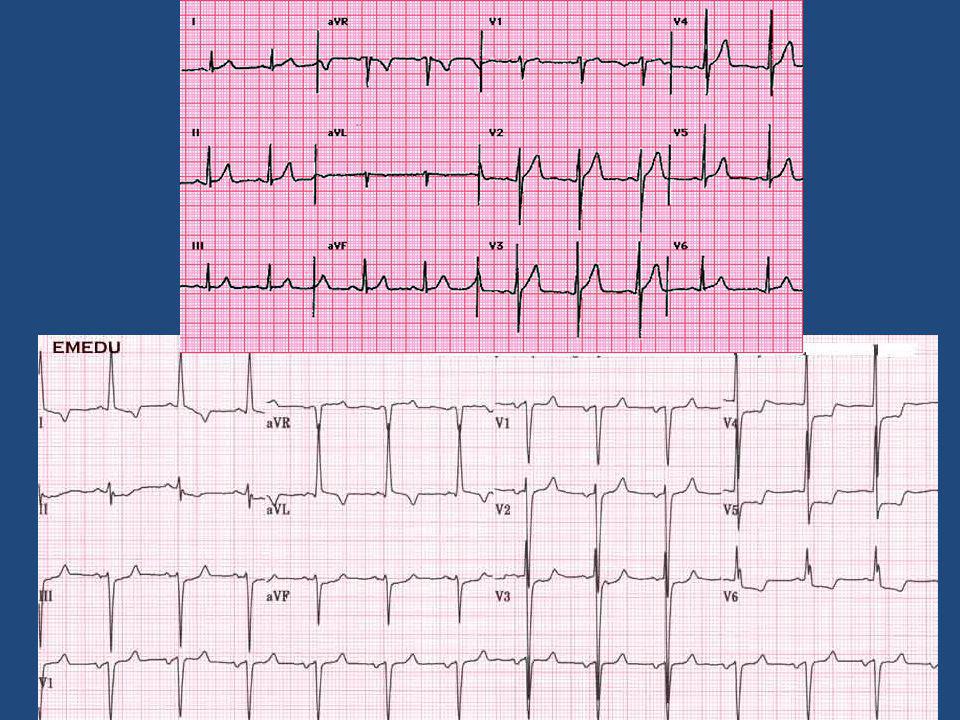
K53 - Linker kamerhypertrofie
(R in V5 of V6) + (S in V1 of V2) > 3,5 mV (35 mm) ST elevatie concaaf naar boven met hoge positieve T top in rechtszijdige afleidingen ST depressie convex naar boven met asymmetrisch negatieve T top in linkszijdige afleidingen Normale as ECG van Rolanbd
 + (S in V1 of V2) > 3,5 mV (35 mm) ST elevatie concaaf naar boven met hoge positieve T top in rechtszijdige afleidingen. ST depressie convex naar boven met asymmetrisch negatieve T top in linkszijdige afleidingen. Normale as. ECG van Rolanbd.")
29
Left Ventricular Hypertrophy
Why is left ventricular hypertrophy characterized by tall QRS complexes? Increased QRS voltage As the heart muscle wall thickens there is an increase in electrical forces moving through the myocardium resulting in increased QRS voltage. LVH ECHOcardiogram For more presentations

30
Left Ventricular Hypertrophy
Criteria exists to diagnose LVH using a 12-lead ECG. For example: The R wave in V5 or V6 plus the S wave in V1 or V2 exceeds 35 mm. However, for now, all you need to know is that the QRS voltage increases with LVH. For more presentations

31
K55 – Rechter kamerhypertrofie
Hoge R in V1 (> 0,7 mV) met R/S ratio > 1 Vlakke R progressie Diepe S in V5-V6 ( > 0,7 mV) met R/S ratio < 1 qR of rSR’ in V1 met hoge spitse R’ (diff. diagnose RBTB) Hoge, terminale R in aVR Rechter asdeviatie (komt overeen met diepe S in I en aVL) Kliniek van longlijden
 met R/S ratio > 1. Vlakke R progressie. Diepe S in V5-V6 ( > 0,7 mV) met R/S ratio < 1. qR of rSR’ in V1 met hoge spitse R’ (diff. diagnose RBTB) Hoge, terminale R in aVR. Rechter asdeviatie (komt overeen met diepe S in I en aVL) Kliniek van longlijden.")
32
Ischemie en Infarkt

33
K56 - Ischemie Wanneer een elektrode geplaatst wordt tegenover een zone van ischemie betekent - ST segment depressie: subendocardiale ischemie - ST segment elevatie: transmurale (subepicardiale) ischemie
 ischemie.")
34
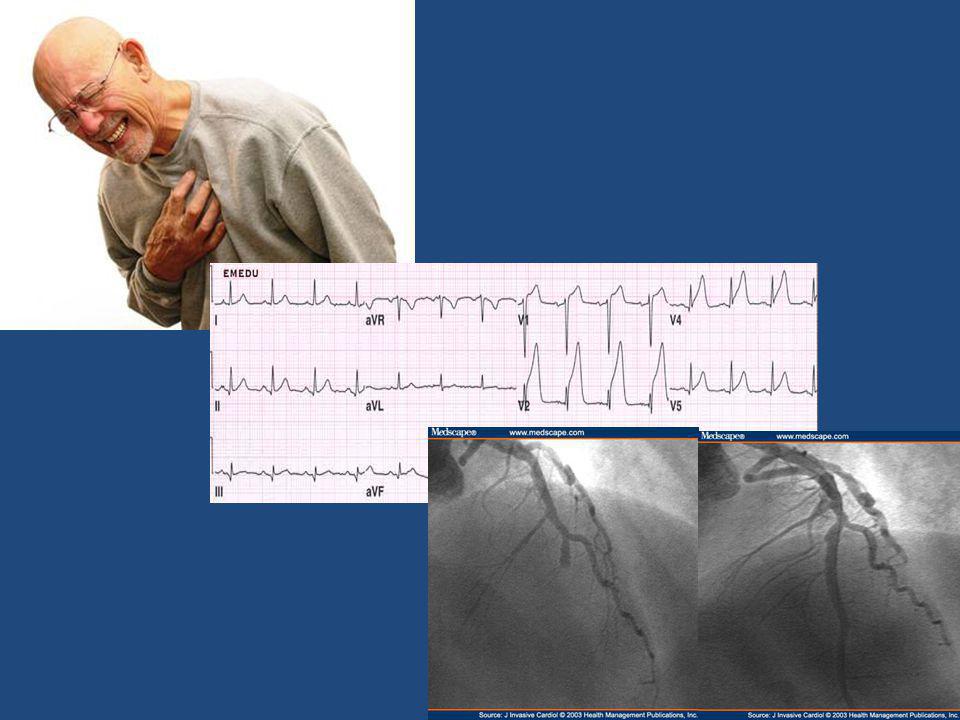
Characteristic changes in AMI
ST segment elevation over area of damage ST depression in leads opposite infarction Pathological Q waves Reduced R waves Inverted T waves Characteristic changes in AMI The 12-lead ECG is the most useful investigation for confirming the diagnosis of acute myocardial infarction, locating the site of the infarct and monitoring the progress. It is therefore very important to know the changes that occur in this situation. The only diagnostic evidence of a completed myocardial infarction seen on the ECG are those in the QRS complexes. In the early stages changes are also seen in the ST segment and the T wave, and these can be used to assist diagnosis of myocardial infarctions. Shortly after infarction there is an elevation of the ST segment seen over the area of damage, and opposite changes are seen in the opposite leads. Several hours later pathological Q waves begin to form, and tend to persist. Later the R wave becomes reduced in size, or completely lost. Later still, the ST segment returns to normal, and at this point the T wave also decreases, eventually becoming deeply and symmetrically inverted. Although these changes occur sequentially, it is very unlikely they will all be clearly observed by the paramedic or GP. A patient can present at any stage and a progression through the ECG changes will not be seen. It is important to recognise these features as they occur rather than in association with each other. All these changes imply myocardial infarction, and will be discussed in more detail over the next few slides.

35
ST elevation Occurs in the early stages
Occurs in the leads facing the infarction Slight ST elevation may be normal in V1 or V2 R P Q ST ST elevation ST segment elevation usually occurs in the early stages of infarction, and may exhibit quite a dramatic change. ST elevation is often upward and concave, although it can appear convex or horizontal. These changes occur in leads facing the infarction. ST elevation is not unique to MIs and therefore is not confirming evidence. Basic requirements of ST changes for diagnosis are: elevation of at least 1 mm in two or more adjoining leads for inferior infarctions (II, III, and aVF), and at least 2 mm in two or more precordial leads for anterior infarction. You should be aware that ST elevation can be seen in leads V1 and V2 normally. However, if there is also elevation in V3 the cause is unlikely to be physiological.
, and at least 2 mm in two or more precordial leads for anterior infarction. You should be aware that ST elevation can be seen in leads V1 and V2 normally. However, if there is also elevation in V3 the cause is unlikely to be physiological.")
36
Deep Q wave Only diagnostic change of myocardial infarction
At least 0.04 seconds in duration Depth of more than 25% of ensuing R wave R P Q T ST Deep Q wave The only diagnostic changes of acute myocardial infarction are changes in the QRS complexes and the development of abnormal Q waves. However, this may be a late change and so is not useful for the diagnosis of AMI in the pre-hospital situation. Remember that Q waves of more than 0.04 seconds , or 1 little square, are not generally seen in leads I, II or the precordial leads.

37
T wave changes Late change
Occurs as ST elevation is returning to normal Apparent in many leads R P Q T ST T wave inversion The T wave is the most unstable feature of the ECG tracing and changes occur very frequently under normal circumstances, limiting their diagnostic value. Subtle changes in T waves are often the earliest signs of myocardial infarction. However, their value is limited for the reason above, but for approximately 20 to 30% of patients presenting with MI, a T wave abnormality is the only ECG sign. The T wave can be lengthened or heightened by coronary insufficiency. T wave inversion is a late change in the ECG and tends to appear as the ST elevation is returning to normal. As the ST segment returns towards the isoelectric line, the T wave also decreases in amplitude and eventually inverts.

38
Bundle branch block Anterior wall MI Left bundle branch block I II III
aVR aVL aVF V1 V2 V3 V4 V5 V6 I II III aVR aVL aVF V1 V2 V3 V4 V5 V6 Bundle branch block Bundle branch block is the pattern produced when either the right bundle or the entire left bundle fails to conduct an impulse normally. The ventricle on the side of the failed bundle branch must be depolarised by the spread of a wave of depolarisation through ventricular muscle from the unaffected side. This is obviously a much slower process and usually the QRS duration is prolonged to at least 0.12 seconds (for right bundle branch block) and 0.14 seconds (for left bundle branch block). The ECG pattern of left bundle branch block (LBBB) resembles that of anterior infarction, but the distinction can readily be made in nearly all cases. Most importantly, in LBBB the QRS is widened to 140 ms or more. With rare exceptions there is a small narrow r wave (less than 0.04 seconds) in V1 to V3 which is not usually seen in anteroseptal infarction. There is also notching of the QRS best seen in the anterolateral leads, and the T wave goes in the opposite direction to the QRS in all the precordial leads. This combination of features is diagnostic. In the rare cases where there may be doubt assume the correct interpretation is LBBB. This will make up no difference to the administration of a thrombolytic on medical direction but for the present will be accepted as a contraindication for paramedics acting autonomously (see later slide). Right bundle branch block is characterised by QRS of 0.12 seconds or wider, an s wave in lead I, and a secondary R wave (R’) in V1. As abnormal Q waves do not occur with right bundle branch block, this remains a useful sign of infarction.
 and 0.14 seconds (for left bundle branch block). The ECG pattern of left bundle branch block (LBBB) resembles that of anterior infarction, but the distinction can readily be made in nearly all cases. Most importantly, in LBBB the QRS is widened to 140 ms or more. With rare exceptions there is a small narrow r wave (less than 0.04 seconds) in V1 to V3 which is not usually seen in anteroseptal infarction. There is also notching of the QRS best seen in the anterolateral leads, and the T wave goes in the opposite direction to the QRS in all the precordial leads. This combination of features is diagnostic. In the rare cases where there may be doubt assume the correct interpretation is LBBB. This will make up no difference to the administration of a thrombolytic on medical direction but for the present will be accepted as a contraindication for paramedics acting autonomously (see later slide). Right bundle branch block is characterised by QRS of 0.12 seconds or wider, an s wave in lead I, and a secondary R wave (R’) in V1. As abnormal Q waves do not occur with right bundle branch block, this remains a useful sign of infarction.")
39
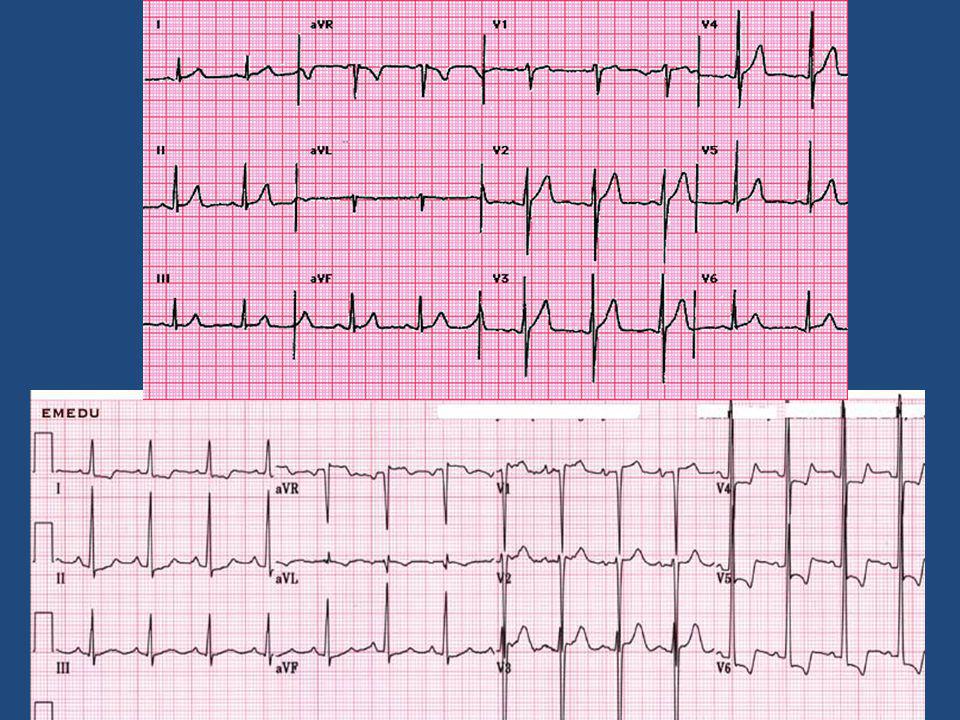
Sequence of changes in evolving AMI
R R R ST T ST P P P T Q S Q Q 1 minute after onset 1 hour or so after onset A few hours after onset R Sequence of changes in evolving AMI The ECG changes that occur due to myocardial infarction do not all occur at the same time. There is a progression of changes correlating to the progression of infarction. Within minutes of the clinical onset of infarction, there are no changes in the QRS complexes and therefore no definitive evidence of infarction. However, there is ST elevation providing evidence of myocardial damage. The next stage is the development of a new pathological Q wave and loss of the r wave. These changes occur at variable times and so can occur within minutes or can be delayed. Development of a pathological Q wave is the only proof of infarction. As the Q wave forms the ST elevation is reduced and after 1 week the ST changes tend to revert to normal, but the reduction in R wave voltage and the abnormal Q waves usually persist. The late change is the inversion of the T wave and in a non-Q wave myocardial infarct, when there is no pathological Q wave, this T wave change may be the only sign of infarction. Months after an MI the T waves may gradually revert to normal, but the abnormal Q waves and reduced voltage R waves persist. In terms of diagnosing AMI in time to make thrombolysis a life-saving possibility, the main change to look for on the ECG is ST segment elevation. ST P P ST T P T T Q Q Q A day or so after onset Later changes A few months after AMI

40
Anterior infarction Anterior infarction I II III aVR aVL aVF V1 V2 V3
Location of infarction and its relation to the ECG: anterior infarction As was discussed in the previous module, the different leads look at different aspects of the heart, and so infarctions can be located by noting the changes that occur in different leads. The precordial leads (V1–6) each lie over part of the ventricular myocardium and can therefore give detailed information about this local area. aVL, I, V5 and V6 all reflect the anterolateral part of the heart and will therefore often show similar appearances to each other. II, aVF and III record the inferior part of the heart, and so will also show similar appearances to each other. Using these we can define where the changes will be seen for infarctions in different locations. Anterior infarctions usually occur due to occlusion of the left anterior descending coronary artery resulting in infarction of the anterior wall of the left ventricle and the intraventricular septum. It may result in pump failure due to loss of myocardium, ventricular septal defect, aneurysm or rupture and arrhythmias. ST elevation in I, aVL, and V2–6, with ST depression in II, III and aVF are indicative of an anterior (front) infarction. Extensive anterior infarctions show changes in V1–6 , I, and aVL. Left coronary artery
 each lie over part of the ventricular myocardium and can therefore give detailed information about this local area. aVL, I, V5 and V6 all reflect the anterolateral part of the heart and will therefore often show similar appearances to each other. II, aVF and III record the inferior part of the heart, and so will also show similar appearances to each other. Using these we can define where the changes will be seen for infarctions in different locations. Anterior infarctions usually occur due to occlusion of the left anterior descending coronary artery resulting in infarction of the anterior wall of the left ventricle and the intraventricular septum. It may result in pump failure due to loss of myocardium, ventricular septal defect, aneurysm or rupture and arrhythmias. ST elevation in I, aVL, and V2–6, with ST depression in II, III and aVF are indicative of an anterior (front) infarction. Extensive anterior infarctions show changes in V1–6 , I, and aVL. Left. coronary. artery.")
41
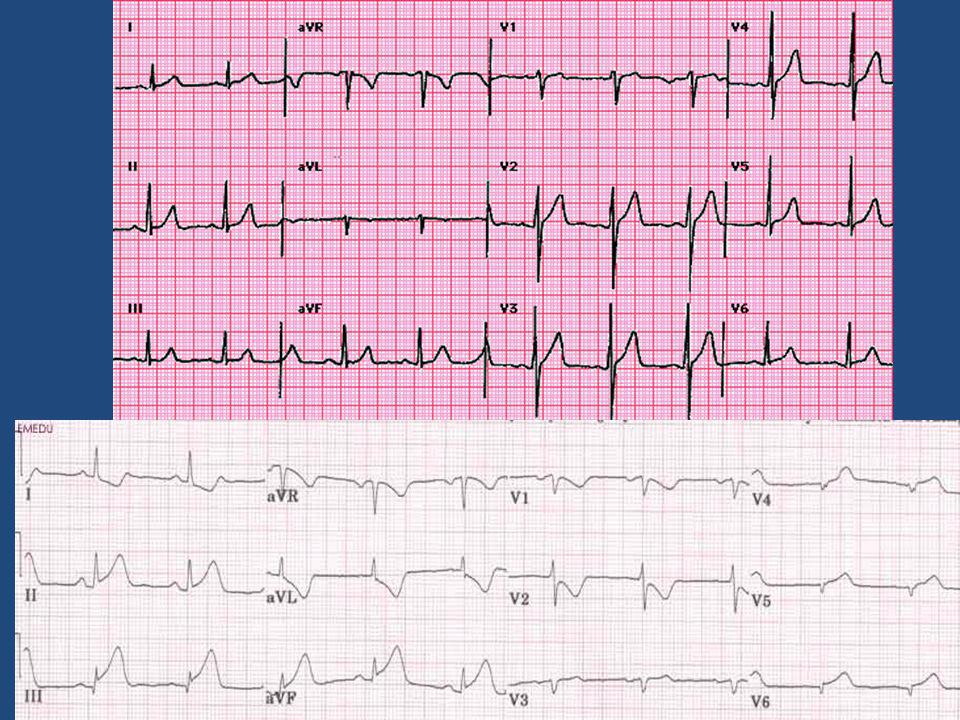
Inferior infarction Inferior infarction I II III aVR aVL aVF V1 V2 V3
Location of infarction and its relation to the ECG: inferior infarction ST elevation in leads II, III and aVF, and often ST depression in I, aVL, and precordial leads are signs of an inferior (lower) infarction. Inferior infarctions may occur due to occlusion of the right circumflex coronary arteries resulting in infarction of the inferior surface of the left ventricle, although damage can be made to the right ventricle and interventricular septum. This type of infarction often results in bradycardia due to damage to the atrioventricular node. Right coronary artery
 infarction. Inferior infarctions may occur due to occlusion of the right circumflex coronary arteries resulting in infarction of the inferior surface of the left ventricle, although damage can be made to the right ventricle and interventricular septum. This type of infarction often results in bradycardia due to damage to the atrioventricular node. Right. coronary. artery.")
42
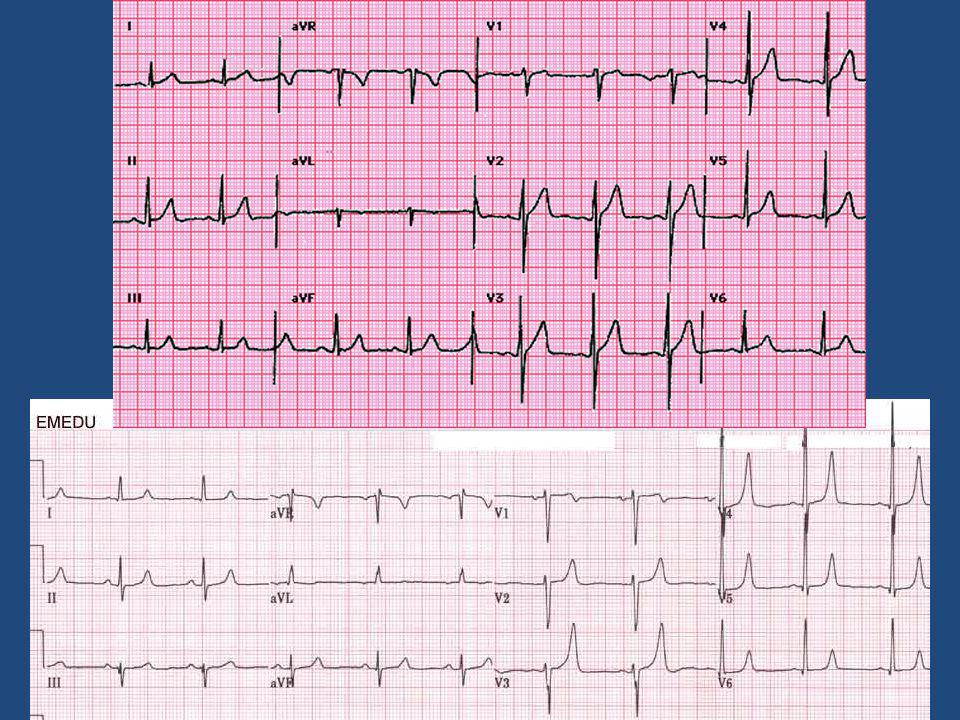
Lateral infarction Lateral infarction I II III aVR aVL aVF V1 V2 V3
Location of infarction and its relation to the ECG: lateral infarction Occlusion of the left circumflex artery may cause lateral infarctions. Lateral infarctions are diagnosed by ST elevation in leads I and aVL. Left circumflex coronary artery

43
Location of infarct combinations
aVR V1 V4 ANT POST LATERAL ANT SEPTAL II aVL V2 V5 Location of infarction: combinations The previous slides discussed the changes that occur in typical anterior, inferior and lateral infarctions. However, the area infarcted is not always limited to these areas and infarctions can extend across two regions. For example, an anterior infarction which is also on the lateral side of the heart is known as an anterolateral infarction. ST segment elevation in leads I and aVL represent a lateral infarction Anteroseptal infarctions show ST segment elevation in leads V1 to V4. ST elevation in V4 to V6 is typical of an anterolateral infarction ST elevation in II, III and aVF is typical of inferior infarction. ANT LAT V3 V6 III aVF INFERIOR

44
Diagnostic criteria for AMI
Q wave duration of more than 0.04 seconds Q wave depth of more than 25% of ensuing r wave ST elevation in leads facing infarct (or depression in opposite leads) Deep T wave inversion overlying and adjacent to infarct Cardiac arrhythmias Diagnostic criteria for AMI Myocardial infarction is the loss of viable, electrically active myocardium. Diagnosis can therefore be made from the ECG. However, only changes in QRS complexes can provide a definite diagnosis. Changes in each of the leads must be noted, along with symptoms, as both are important in making a diagnosis. Excluding leads aVR and III, Q wave duration of more than 0.04 seconds or depth of more than 25% of the ensuing r wave are proof of infarction. Other criteria are the development of QS waves and local area low voltage r waves. Although these are useful diagnostic features, there are additional features that are associated with myocardial infarction as have been described in the previous slides. These include ST elevation in the leads facing the infarct, ST depression (reciprocal) in the opposite leads to the infarct, deep T wave inversion overlying and adjacent to the infarct, abnormally tall T waves facing the infarct, and cardiac arrhythmias. These extra features may aid in the diagnosis of myocardial infarction from an ECG.
 Deep T wave inversion overlying and adjacent to infarct. Cardiac arrhythmias. Diagnostic criteria for AMI. Myocardial infarction is the loss of viable, electrically active myocardium. Diagnosis can therefore be made from the ECG. However, only changes in QRS complexes can provide a definite diagnosis. Changes in each of the leads must be noted, along with symptoms, as both are important in making a diagnosis. Excluding leads aVR and III, Q wave duration of more than 0.04 seconds or depth of more than 25% of the ensuing r wave are proof of infarction. Other criteria are the development of QS waves and local area low voltage r waves. Although these are useful diagnostic features, there are additional features that are associated with myocardial infarction as have been described in the previous slides. These include ST elevation in the leads facing the infarct, ST depression (reciprocal) in the opposite leads to the infarct, deep T wave inversion overlying and adjacent to the infarct, abnormally tall T waves facing the infarct, and cardiac arrhythmias. These extra features may aid in the diagnosis of myocardial infarction from an ECG.")
Verwante presentaties


![Deltion College Engels C1 Spreken [Edu/003] thema “Oprah at Deltion” can-do : kan duidelijke, gedetailleerde beschrijving geven van complexe onderwerpen,](/8/2033280/big_thumb.jpg "Deltion College Engels C1 Spreken [Edu/003] thema “Oprah at Deltion” can-do : kan duidelijke, gedetailleerde beschrijving geven van complexe onderwerpen,>")

![Deltion College Engels C1 Gesprekken voeren [Edu/002]/ subvaardigheid lezen thema: Order, order…. can-do : kan een bijeenkomst voorzitten © Anne Beeker.](/8/2048322/big_thumb.jpg "Deltion College Engels C1 Gesprekken voeren [Edu/002]/ subvaardigheid lezen thema: Order, order…. can-do : kan een bijeenkomst voorzitten © Anne Beeker.>")


to watch throughout the month of August,>")


