Download de presentatie
De presentatie wordt gedownload. Even geduld aub

1
Timing………. Petra Hajenius

2
Incidentie en risicofactoren
Diagnostiek Therapie Lopend onderzoek Nieuwe ontwikkelingen

3
EUG studie groep

4
Incidentie (1980-2005) 45,799 EUGs 2,952,607 levend geborenen
Opnames voor EUG per levend geborenen APC % CI * , 18.2 , 6.4 * , -1.5 In this 25 yr time period a total number of almost 46 thousend women where admitted for EP and almost 3 miljoen women gave birth to a live child. The yellow line represents the risk of having an ectopic pregnancy, in other words: the result of the number of women admitted to the hospital for EP, per year, per 1000 women having a live birth in the same yr. Women who conceived in 1980 had a risk of having an EP of 7/1000 LB or 1 in every 140 LB. In 1988 a peak incidence was recognized when women had an almost 40% increased riks compared to 1980: 11/ 1000 pregnancies or a risk of 1 in every 85 LB. Thereafter the EP rate showed a consistent decline to a risk at the same level compared to the EP rate in 1980. It would be interesting to know if this presented change in risk for EP was the same in the whole country, or that we could have identified certain areas at increased risk, especially since we keep the hypothesized relation with sexual behaviour in mind. F Mol et al. Submitted * Chi square test p< 4

5
Opnames voor EUG per 1.000 levend geborenen
4 grote steden vs rest NL Opnames voor EUG per levend geborenen APC 95% CI -4.1* , -3.1 -1.4* , -0.8 This slide represents the risk of women having an ep living in 1 of the four major cities, presented by the yellow line, compared to women living in rural areas of the country, presented in red. This graph shows that the observed nation wide decline, is mainly due to the decline in urban areas. But this differcence it not longer recognized in the last two years. We can say that women who lived in an urban area in the ninties and tried to conceive had an almost two fold increased risk of having an EP than women living in urban area, 15 yrs later. 5

6
Incidentie per leeftijdsgroep
APC % CI - 4.8* , -4.1 -1.9* , -1.2 -0.3* , 1.0 Opnames voor EUG per levend geborenen Subgroup analysis for the three different age groups showed an overall decline for the older and for the mid range but not for women under 25 yr, but the major decline in risk of having an EP is for women over >35 especially in the early nineties. women in the older age group (over 35) in the early nineties had an two fold increased risk compared to women under 25 yr 6
 in the early nineties had an two fold increased risk compared to women under 25 yr. 6.")
7
Incidentie en sexueel gedrag
HAART 1960 1970 1980 1990 2000 25/03/1969 Hiv1983, ART 1995 Ectopic pregnancy rates in perspective of changes in sexual behaviour. First I show you a photograph of Jonhn Lennon in the Amsterdam Hilton Hotel on 25/03/1969 as a representative of the sexual revolution for many young people in the western world. This enormous change in sexual behaviour, was immediately followed by a change in ectopic pregnency rates and EP was described in the seventies as the new surgical epidemic by Weinstein. In the eighties another change in sexual behaviour is recognized, this time by the discovery of AIDS and HIV. As a result af the AIDS fobia and safe sex campaingns, incidences of other STD’s declined, but safe sex did not prevent the pandemic of HIV. Simultaniously a decline of EP rates was recognized and the epidemic of EP was reported to “seems to be over” again. In 1995, since the introduction of highly effictive anti retroviral therapie in the western world, young people consider HIV not longer as a deathly disease, but more a chronic sort of state in which you might even live another yrs. Young people seem to withdraw from safe sex. We hypothesize if this change in sexual behaviour again mmight have influenced ectopic pregnancy rates in the last decade and in the near future. In order to predict future ectopic pregnancy rate, first we need to ? “Ectopic pregnancy - a new surgical epidemic” “Ectopic pregnancy - the epidemic seems to be over” 7

8
EUG versus PID / Chlamydia
Opnames EUG per levendgeborenen Opnames voor PID per vrouwen Chlamydia positieve test x This last graph compares the EP rates with the incidences of the risk factors: PId or chlamydia infection. For PID, presented in the red line and in absolute numbers on the left Y axe. In 1983 a peak incidence of admissions was recognized, and followed six yrs later by the peak incidence for Ectopic pregnancy, presented in yellow and the EP rate on the right Y axe. After 1983, PID showed a consistent decline to an average of 2000 admissions per yr. For chlamydia infection presented in light blue, an tremendous increase has been shown. Although I have mentioned the limitations of the registraion of Chlamydia infection and the risk of screening bias, this increase could still of significance. Especially since we know that women in the region of Amsterdam under 25 and from different ethnic groups had an incidence upto 25% of Chlamydia infection in 2004 and 2005. 8

9
Toekomst incidentie……
Chlamydia trachomatis neemt toe screening bias vooral bij vrouwen < 25 jaar in stedelijke gebieden Anno 2005 vrouwen < 25 jaar opnieuw een verhoogd risico op EUG So far we have presented, consistent with international literature a peak incidence in 1989 and an overall nationwide decline in ectopic pregnancy rate. Women had an increased risk in urban areas and in older age groups, especially if born in the ninty fifties, but risk of EP mainly diminished within these groups. On the contrary we recognized an increased risk for young women under 25 born in the late eighties who might not yet stand on the doorstep of their reproductive career. Chlamydia infection increases Although we have to take into account the risk of screening bias, there are strong indications that chlamydia is, especially a problem in young women who live in urban areas. Of these women the majority will try to conceive the next decade. What can we expect for the near future? ≥ 35 25-35 < 25 Van der Bij STD 2007 9

10
Kadar et al. Obstet Gynecol 1981
Diagnostiek laparoscopie serum hCG DZ principe echoscopie Kadar et al. Obstet Gynecol 1981 hCG test (urine) klinische verdenking
 klinische verdenking.")
11
Ankum et al. Hum Reprod 1993, BW Mol et al. Fertil Steril 1998
Diagnostisch algoritme echo uterus IUG PUL > 50% daling ? ja vervolgen echo adnexa nee intra-uteriene vruchtzak? procentueel verschil? < 50% daling of stijging > 50% stijging ja ectopische vruchtzak? nee serum HCG ectopic mass of vrij vocht? HCG >2000 IU/L ? nee serum HCG nee nee IUG of EUG zichtbaar? IUG EUG ja ja serum HCG echoscopie na 48 uur IUG nee HCG > 1500 IU/L ? IUG of EUG zichtbaar? nee HCG >1500 IU/L ? nee echoscopie na 48 uur serum HCG ja EUG ja EUG Ankum et al. Hum Reprod 1993, BW Mol et al. Fertil Steril 1998

12
Serum hCG afkapwaarden

13
Na 2 en 4 dagen failing PUL bij > 50% daling
persisting PUL bij < 50% stijging en < 50% daling ? bij > 50% stijging

14
Innovatie ?

15
Toekomst diagnostiek……
Think ectopic Implementatie onderzoek Meta analyse diagnostiek / IPD Serum progesteron bij PUL Probabilistische aanpak

16
Therapie 35 RCTs 25 vergelijkingen Uitkomstmaten I. Chirurgie
II. Medicamenteuze behandeling III. Expectatief beleid Uitkomstmaten succesvolle behandeling persisterende trofoblast toekomstige fertiliteit kosten kwaliteit van leven Hajenius et al. Cochrane review 2000, update Jan 2007

17
Welke opties? Chirurgie MTX Afwachtend beleid Laparotomie Laparoscopie
Systemisch MTX lokaal US/scopie MTX 1 mg/kg im dag 0,2,4,6 CF 0.1 mg/kg oraal dag 1,3,5,7 Salpingectomie per tomie Salpingectomie per scopie Fixed multiple dose Alleen mtx, omdat de gangbare behandeling Salpingostomie per tomie Salpingostomie per scopie + SS MTX (OK) Single dose MTX 1 mg/kg im
 Single dose. MTX 1 mg/kg im.")
18
Persisterende trofoblast
NNT = 10 serum hCG monitoring Indien PT single dose MTX

19
Systemisch MTX

20
De klinische praktijk Chirurgie MTX Laparoscopie Systemisch
Salpingectomie Fixed multiple dose serum hCG < IU/L geen foetale hartactie Alleen mtx, omdat de gangbare behandeling Salpingostomie Single dose serum hCG < IU/L geen foetale hartactie F Mol et al. Hum Reprod Update accepted

21
Behandeling in NL ( ) 2005: opnames EUG n=1375, OK n=1222 salpingo(s)tomie n=298 salpingectomie n=811 laparoscopie n=862, laparotomie n=216
 2005: opnames EUG n=1375, OK n=1222 salpingo(s)tomie n=298 salpingectomie n=811 laparoscopie n=862, laparotomie n=216.")
22
Behandeling in NL (1991-2005) Absoluut aantal opnames en ok voor EUG
% van totaal aantal ok’s Absoluut aantal opnames en ok voor EUG % salpingo(s)tomie % laparoscopie Opname OK
tomie. % laparoscopie. Opname. OK.")
23
Therapie toekomst…… Salpingostomie vs salpingectomie
MTX im vs expectatief beleid MTX im verschillende dosis

24
Sparend vs radicaal ? n = 191 n = 135 met kinderwens
Fertiliteit uitkomsten salpingostomie IUG 62% EUG 28% salpingectomie IUG 38% EUG 23% Life table analyse FRR IUG 1.9 ( ) FRR EUG 2.4 ( ) Sub analyse tuba pathologie in VG + FRR IUG 3.1 ( ) - FRR IUG 1.4 ( ) BW Mol et al. Hum Reprod 1998
 FRR EUG 2.4 ( ) Sub analyse. tuba pathologie in VG. + FRR IUG 3.1 ( ) - FRR IUG 1.4 ( ) BW Mol et al. Hum Reprod")
25
ESEP studie (n=450) P: tubaire EUG met normale contralaterale tuba
I: salpingotomie C: salpingectomie O: spontane IUG persisterende trofoblast, recidief EUG, kosten

26
Inclusie tot n=217 Dicht: Totaal randomisatie, cursief: vanaf

27
Ankum et al. Hum Reprod 1993, BW Mol et al. Fertil Steril 1998
Persisting PUL echo uterus IUG PUL > 50% daling ? ja vervolgen echo adnexa nee intra-uteriene vruchtzak? procentueel verschil? < 50% daling of stijging > 50% stijging ja ectopische vruchtzak? nee serum HCG ectopic mass of vrij vocht? HCG >2000 IU/L ? nee serum HCG nee nee IUG of EUG zichtbaar? IUG EUG ja ja serum HCG echoscopie na 48 uur IUG nee HCG > 1500 IU/L ? IUG of EUG zichtbaar? nee HCG >1500 IU/L ? nee echoscopie na 48 uur serum HCG ja EUG ja EUG Ankum et al. Hum Reprod 1993, BW Mol et al. Fertil Steril 1998

28
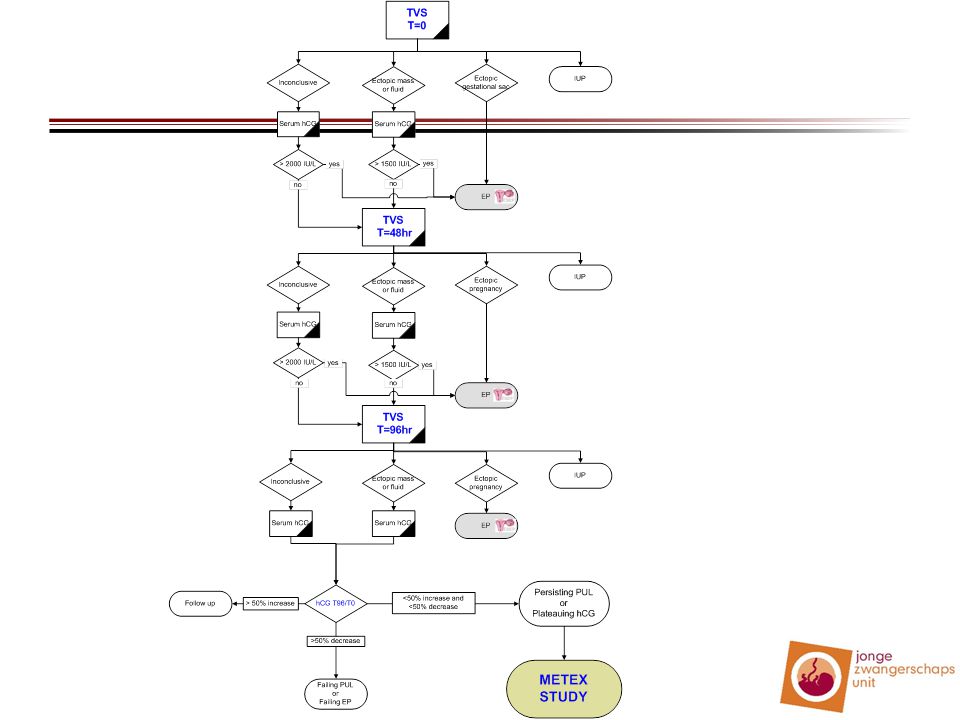
METEX studie (n=72) P: persisting PUL < IU/l, EUG < IU/l I: expectatief beleid C: methotrexaat single dose O: succesvolle behandeling (hCG < 2 IU/l) kwaliteit van leven kosten (fertiliteit)
 kwaliteit van leven. kosten. (fertiliteit)")
29
Methoden Expectatief beleid: geen interventie
Methotrexaat behandeling: 1 mg/kg im Follow-up: wekelijks poliklinisch serum hCG MTX groep Hb, Ht, Tr, L, lever- en nier functie

30
Follow-up dag 7 Expectatieve groep MTX groep > 15% daling
succesvolle behandeling > 15% stijging start MTX Plateau = < 15% daling en < 15% stijging Serum hCG na 48 uur Bij aanhoudend plateauend hCG of stijging MTX groep > 15% daling succesvolle behandeling < 15% daling of stijgend hCG MTX herhalen tot 4 x max. Mtx groep int lit / exp groep obv engelse studie In alle gevallen bij klinische symptomen chirurgische interventie

31
Nieuwe ontwikkelingen
Early Pregnancy Units buikpijn en/of bloedverlies in het 1e trimester zwangere vrouwen zonder klachten maar met abnormale echoscopische bevindingen in het 1e trimester vrouwen met herhaalde miskramen in de anamnese

32
Evidence UK/ Scandinavie
Aanbeveling special interest group Early Pregnancy 60% minder herhaalconsulten 50% minder ziekenhuisopnames Vermindering werkbelasting ziekenhuispersoneel gedurende avond/nacht Kostenreductie en verbetering KvZ door snelle en adequate diagnostiek in kantoortijd opstellen van een individueel beleidsplan Bigrigg et al. BMJ 1991, Sorensen Ugeskr Laeger 1999, Brownlea A NZ J Obstet Gynecol 2005

33
JZU Bundeling van expertise 3e lijns verwijs/adviescentrum
Centralisatie van zorg verbetering van patiëntenzorg patiëntentevredenheid logistiek onderwijs wetenschap Elektronisch zorgregistratiesysteem

34
Conclusies Verwachte stijging incidentie
Incorporeren serum progesteron in algoritme bij PUL Patiënten includeren in ESEP en METEX studie Jonge Zwangerschaps Units NL

Verwante presentaties