Download de presentatie
De presentatie wordt gedownload. Even geduld aub

1
Solar Cycle 24: Midlifecrisis van een zonnecyclus?
Jan Janssens november 2011

2
Wat is de zon? Een gemiddelde ster Dichtst bij de aarde Zeer groot
km (1 A.E.) Zeer groot km Zeer heet Oppervlakte: °C Inwendig: 15 miljoen °C Plasma Geladen deeltjes Magnetisme Differentiële rotatie Polen roteren trager dan aan evenaar De zon is een ster Groot km = 109 * aarde Duurt ongeveer een half jaar om met een Boeing 747 éénmaal om de zon te vliegen (1000 km/h) Zwaar 1,99 * 1030 kg = * aarde Dichtstbij km = 1 Astronomische Eenheid Plasma op aarde: bliksem, elektrostatische vonken, poollicht, plasmasferen
 Zeer groot km. Zeer heet. Oppervlakte: °C. Inwendig: 15 miljoen °C. Plasma. Geladen deeltjes. Magnetisme. Differentiële rotatie. Polen roteren trager dan aan evenaar. De zon is een ster. Groot km. = 109 * aarde. Duurt ongeveer een half jaar om met een Boeing 747 éénmaal om de zon te vliegen (1000 km/h) Zwaar. 1,99 * 1030 kg. = * aarde. Dichtstbij km. = 1 Astronomische Eenheid. Plasma op aarde: bliksem, elektrostatische vonken, poollicht, plasmasferen.")
3
Zonnevlekken Ondiepe depressies in de fotosfeer door magnetische storingen die het opstijgen van heet gas uit het zonne-inwendige verhindert Temperatuur Umbra: 3500°C Penumbra: 4200°C Minstens 1500 Gauss nodig voor zonnevlek(je) In principe Gauss Aards magneetveld aan polen: 0,25-0,65 Gauss Fotosfeer: 1 Gauss
 In principe Gauss. Aards magneetveld aan polen: 0,25-0,65 Gauss. Fotosfeer: 1 Gauss.")
4
Zonnevlekken Magneetveld 3000* sterker dan ongestoorde fotosfeer
Bipolair Tegengestelde polariteit

5
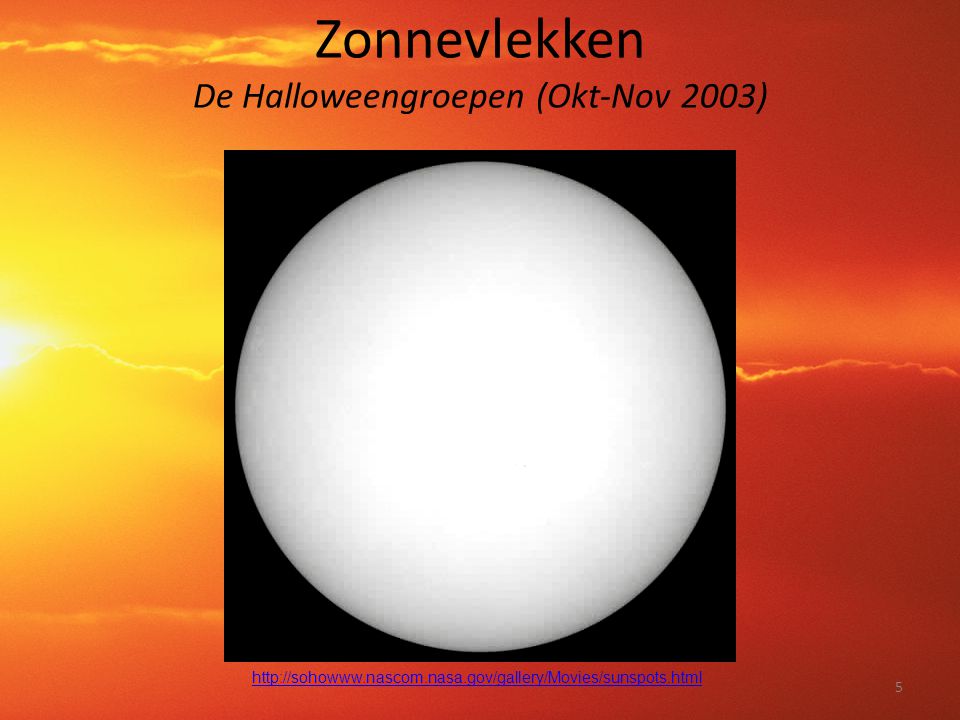
Zonnevlekken De Halloweengroepen (Okt-Nov 2003)
6
Het zonnevlekkengetal
R = 10.g + f, met g het # groepen, en f het # vlekken 1700-heden Tot 1749: slechts jaarlijkse waarden Officieel: vanaf 1749 Dagelijks vanaf 1849 Rudolf Wolf => “Wolfgetal” Zonnevlekkengetal (SSN) Verschillende waarnemers Actueel: Locarno (SIDC) SIDC: Solar Influences Data analysis Center
 Verschillende waarnemers. Actueel: Locarno (SIDC) SIDC: Solar Influences Data analysis Center.")
7
Zonnecycli !

8
De zonnecyclus Rmax: 117 +/- 42 Tmax: 51 +/- 13 D: 132 +/- 16 maand
De zonnecyclus werd in 1843 ontdekt door Heinrich Schwabe

9
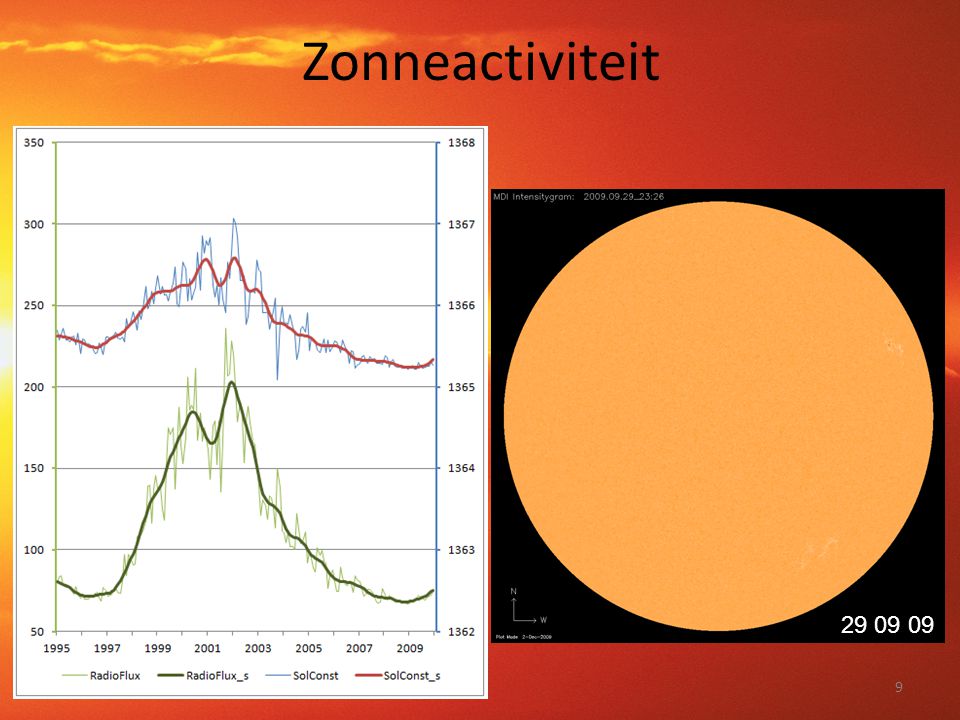
Zonneactiviteit
10
De zonnedynamo Zonnevlekkencylus Vlinderdiagram Wet van Joy
+/- 11 jaar Vlinderdiagram Wet van Joy Helling bipolaire groepen neemt toe met de breedte Polariteitswet van Hale Magnetische cyclus 22 jaar Magnetische velden aan de zonnepolen Wisselen om tijdens cyclusmaximum

11
Magnetische zonnecyclus
1) the 11-year period of the sunspot cycle, 2) the equator-ward drift of the active latitude as seen in the butterfly diagram, 3) Hale's polarity law and the 22-year magnetic cycle, 4) Joy's law for the observed tilt of sunspot groups and, 5) the reversal of the polar magnetic fields near the time of cycle maximum as seen in the magnetic butterfly diagram.
 the 11-year period of the sunspot cycle, 2) the equator-ward drift of the active latitude as seen in the butterfly diagram, 3) Hale s polarity law and the 22-year magnetic cycle, 4) Joy s law for the observed tilt of sunspot groups and, 5) the reversal of the polar magnetic fields near the time of cycle maximum as seen in the magnetic butterfly diagram.")
12
Afstand tot het centrum van de Zon (km)
Helioseismologie Kern Stralingszone Convectiezone Afwijking GONG-data t.o.v. Standaardmodel (%) Afstand tot het centrum van de Zon (km) 0,4 0,2 -0,2 -0,4 Zon – Standaard Model = studie van het zonne-inwendige via trillingen Standaardmodel grotendeels correct Kleine afwijkingen in kern, aan oppervlak en tachocline (turbulentie) Differentiële rotatie Polen roteren trager dan aan evenaar Kern en stralingszone roteren constant Tachocline = plaats waar magnetisch veld van de zon wordt opgewekt Helioseismologie = studie van het inwendige van de zon Net zoals op aarde uit aardbevingen Op de zon uit de op- en neergaande bewegingen in de fotosfeer Doppler-effect Via zonnespectrum Storingen t.g.v. allerhande plasmabewegingen Golf begrensd aan het “zonneoppervlak” door de plotselinge drukdaling, in het inwendige zorgt de toenemende temperatuur ervoor dat de golf teruggereflecteerd wordt Golven moeten geheel aantal keren in elkaar passen (versterking, net zoals bij orgelpijp) Dr. Dikpati said in an interview, “This is the first time that the Sun’s conveyor-belt has been measured accurately enough for two consecutive cycles (cycles 22 spanning approximately and cycle 23 spanning ). From these data we now know that cycle 22 had a shorter conveyor-belt reaching only to 60-degree latitude, while cycle 23 had a long conveyor-belt extending all the way to the pole.” The conveyor belt of plasma flowing in the chromosphere and photosphere essentially drags along with it the magnetic flux of the Sun. Because the extent of the conveyor belt reached a higher latitude, it took the magnetic flux longer to return to the equator, resulting in the delay of sunspots marking the onset of cycle 24. Dr. Dikpati and her team determined that it wasn’t the speed of the flow of plasma conveyor belt that lengthened the solar cycle, but the extent into higher latitudes, and slower return to the equator. Though the speed of the conveyor belt was a bit higher than usual over the past five years, it also stretched much further than during a normal cycle. Plasma flowing poleward at the solar surface and returning equatorward near the base of the convection zone, called the meridional circulation, constitutes the Sun's conveyor-belt. Just as the Earth's great oceanic conveyor-belt carries thermal signatures that determine El Nino events, the Sun's conveyor-belt determines timing, amplitude and shape of a solar cycle in flux-transport type dynamos. In cycle 23, the Sun's surface poleward meridional flow extended all the way to the pole, while in cycle 22 it switched to equatorward near 60°. Simulations from a flux-transport dynamo model including these observed differences in meridional circulation show that the transport of dynamo-generated magnetic flux via the longer conveyor-belt, with slower return-flow in cycle 23 compared to that in cycle 22, may have caused the longer duration of cycle 23. (GRL, July 2010, Dikpati) "According to our model, the trouble with sunspots actually began in back in the late 1990s during the upswing of Solar Cycle 23," said co-author Andrés Muñoz-Jaramillo of the Harvard-Smithsonian Centre for Astrophysics in Massachusetts. "At that time the conveyor belt sped up." The fast-moving belt rapidly dragged sunspot corpses down to sun's inner dynamo for amplification. At first glance, this might seem to boost sunspot production, but no. When the remains of old sunspots reached the dynamo, they rode the belt through the amplification zone too hastily for full re-animation. Sunspot production was stunted. Later, in the 2000s, according to the model, the Conveyor Belt slowed down again, allowing magnetic fields to spend more time in the amplification zone, but the damage was already done. New sunspots were in short supply. Adding insult to injury, the slow moving belt did little to assist re-animated sunspots on their journey back to the surface, delaying the onset of Solar Cycle 24.
 Afstand tot het centrum van de Zon (km) 0,4. 0,2. -0,2. -0,4. Zon – Standaard Model. = studie van het zonne-inwendige via trillingen. Standaardmodel grotendeels correct. Kleine afwijkingen in kern, aan oppervlak en tachocline (turbulentie) Differentiële rotatie. Polen roteren trager dan aan evenaar. Kern en stralingszone roteren constant. Tachocline = plaats waar magnetisch veld van de zon wordt opgewekt. Helioseismologie. = studie van het inwendige van de zon. Net zoals op aarde uit aardbevingen. Op de zon uit de op- en neergaande bewegingen in de fotosfeer. Doppler-effect. Via zonnespectrum. Storingen t.g.v. allerhande plasmabewegingen. Golf begrensd aan het zonneoppervlak door de plotselinge drukdaling, in het inwendige zorgt de toenemende temperatuur ervoor dat de golf teruggereflecteerd wordt. Golven moeten geheel aantal keren in elkaar passen (versterking, net zoals bij orgelpijp) Dr. Dikpati said in an interview, This is the first time that the Sun’s conveyor-belt has been measured accurately enough for two consecutive cycles (cycles 22 spanning approximately and cycle 23 spanning ). From these data we now know that cycle 22 had a shorter conveyor-belt reaching only to 60-degree latitude, while cycle 23 had a long conveyor-belt extending all the way to the pole. The conveyor belt of plasma flowing in the chromosphere and photosphere essentially drags along with it the magnetic flux of the Sun. Because the extent of the conveyor belt reached a higher latitude, it took the magnetic flux longer to return to the equator, resulting in the delay of sunspots marking the onset of cycle 24. Dr. Dikpati and her team determined that it wasn’t the speed of the flow of plasma conveyor belt that lengthened the solar cycle, but the extent into higher latitudes, and slower return to the equator. Though the speed of the conveyor belt was a bit higher than usual over the past five years, it also stretched much further than during a normal cycle. Plasma flowing poleward at the solar surface and returning equatorward near the base of the convection zone, called the meridional circulation, constitutes the Sun s conveyor-belt. Just as the Earth s great oceanic conveyor-belt carries thermal signatures that determine El Nino events, the Sun s conveyor-belt determines timing, amplitude and shape of a solar cycle in flux-transport type dynamos. In cycle 23, the Sun s surface poleward meridional flow extended all the way to the pole, while in cycle 22 it switched to equatorward near 60°. Simulations from a flux-transport dynamo model including these observed differences in meridional circulation show that the transport of dynamo-generated magnetic flux via the longer conveyor-belt, with slower return-flow in cycle 23 compared to that in cycle 22, may have caused the longer duration of cycle 23. (GRL, July 2010, Dikpati) According to our model, the trouble with sunspots actually began in back in the late 1990s during the upswing of Solar Cycle 23, said co-author Andrés Muñoz-Jaramillo of the Harvard-Smithsonian Centre for Astrophysics in Massachusetts. At that time the conveyor belt sped up. The fast-moving belt rapidly dragged sunspot corpses down to sun s inner dynamo for amplification. At first glance, this might seem to boost sunspot production, but no. When the remains of old sunspots reached the dynamo, they rode the belt through the amplification zone too hastily for full re-animation. Sunspot production was stunted. Later, in the 2000s, according to the model, the Conveyor Belt slowed down again, allowing magnetic fields to spend more time in the amplification zone, but the damage was already done. New sunspots were in short supply. Adding insult to injury, the slow moving belt did little to assist re-animated sunspots on their journey back to the surface, delaying the onset of Solar Cycle page=0%2C0.")
13
Zonnedynamo Solar cycles are produced by a flux transport dynamo involving the following processes: • Toroidal field generation in tachocline by differential rotation • Poloidal field generation at surface by Babcock- Leighton mechanism • Advection by meridional circulation Irregularities in cycles are primarily caused by fluctuations in the Babcock-Leighton process De magnetische velden worden meegenomen door de plasma-transportband zoals een beekje bladeren van een boom met zich meevoert. (a) Shearing of poloidal field by the Sun's differential rotation near convection zone bottom. The Sun rotates faster at the equator than the pole. (b) Toroidal field produced due to this shearing by differential rotation. (c) When toroidal field is strong enough, buoyant loops rise to the surface, twisting as they rise due to rotational influence. Sunspots (two black dots) are formed from these loops. (d,e,f) Additional flux emerges (d,e) and spreads (f) in latitude and longitude from decaying spots (as described in figure 5 of \citet{babcock61}). (g) Meridional flow (yellow circulation with arrows) carries surface magnetic flux poleward, causing polar fields to reverse. (h) Some of this flux is then transported downward to the bottom and towards the equator. These poloidal fields have sign opposite to those at the beginning of the sequence, in frame (a). (i) This reversed poloidal flux is then sheared again near the bottom by the differential rotation to produce the new toroidal field opposite in sign to that shown in (b).
 Shearing of poloidal field by the Sun s differential rotation near convection zone bottom. The Sun rotates faster at the equator than the pole. (b) Toroidal field produced due to this shearing by differential rotation. (c) When toroidal field is strong enough, buoyant loops rise to the surface, twisting as they rise due to rotational influence. Sunspots (two black dots) are formed from these loops. (d,e,f) Additional flux emerges (d,e) and spreads (f) in latitude and longitude from decaying spots (as described in figure 5 of \citet{babcock61}). (g) Meridional flow (yellow circulation with arrows) carries surface magnetic flux poleward, causing polar fields to reverse. (h) Some of this flux is then transported downward to the bottom and towards the equator. These poloidal fields have sign opposite to those at the beginning of the sequence, in frame (a). (i) This reversed poloidal flux is then sheared again near the bottom by the differential rotation to produce the new toroidal field opposite in sign to that shown in (b)")
14
Zonnedynamo Solar cycles are produced by a flux transport dynamo involving the following processes: • Toroidal field generation in tachocline by differential rotation • Poloidal field generation at surface by Babcock- Leighton mechanism • Advection by meridional circulation Irregularities in cycles are primarily caused by fluctuations in the Babcock-Leighton process De magnetische velden worden meegenomen door de plasma-transportband zoals een beekje bladeren van een boom met zich meevoert.

15
Zonne-uitbarstingen

16
13 December 2006 NOAA 0930 – X3,4

17
Bastille Day Event 14 Juli 2000 – X5,7

18
Het ruimteweer …alle omstandigheden op de zon en in de zonnewind, magnetosfeer, ionosfeer en thermosfeer die de prestaties en de betrouwbaarheid van technologische systemen in de ruimte en op grond kunnen beïnvloeden en die een gevaar kunnen betekenen voor het menselijk leven of de gezondheid. NSWP National Space Weather Program (USA) ... conditions on the sun and in the solar wind, magnetosphere, ionosphere and thermosphere that can influence the performance and reliability of space-borne and ground-based technological systems and can endanger human life or health. (NSWP)
 ... conditions on the sun and in the solar wind, magnetosphere, ionosphere and thermosphere that can influence the performance and reliability of space-borne and ground-based technological systems and can endanger human life or health. (NSWP)")
19
Ruimteweer Invloed van zonne-uitbarstingen
Gebeurtenis Straling (X-ray) Protonstorm CME Flare (in zonnevlekken) Ja Soms Dikwijls Coronaal gat Nee Filament/protuberans eruptie (buiten zonnevlekken) Soms (Hyder flare) Zelden
 Protonstorm. CME. Flare (in zonnevlekken) Ja. Soms. Dikwijls. Coronaal gat. Nee. Filament/protuberans eruptie. (buiten zonnevlekken) Soms (Hyder flare) Zelden.")
20
Ruimteweer Invloed van zonne-uitbarstingen
Wat Wanneer Parameter Bescherming Straling (X-ray) t0 R1 (licht) => R5 (extreem) M1 => > X20 Aardatmosfeer Proton storm min S1 (licht) => S5 (extreem) Pfu (>10MeV): 10 => 105 Magneetveld Aarde Geomagnetische storm (CME) 20-72 uur G1 (licht) => G5 (extreem) Kp = 5 => Kp = 9
 t0. R1 (licht) => R5 (extreem) M1 => > X20. Aardatmosfeer. Proton storm min. S1 (licht) => S5 (extreem) Pfu (>10MeV): 10 => 105. Magneetveld Aarde. Geomagnetische storm (CME) uur. G1 (licht) => G5 (extreem) Kp = 5 => Kp = 9.")
21
Invloed van zonne-uitbarstingen Radio Black-outs

22
Effect van Protonstormen
A polar cap absorption event results from the ionisation of the D-layer of the polar ionosphere by high energy protons. A PCA causes a HF radio blackout for trans polar circuits and can last several days. PCAs are almost always preceded by a major solar flare with the time between the flare event and the onset of the PCA ranging from few minutes to several hours.

23
Geomagnetische Storm Poollicht
Kleuren >200 km: zuurstof: rood <200 km: stikstof: blauw <200 km: zuurstof: groen <100 km: stikstof: krimson Terje Sørgjerd

24
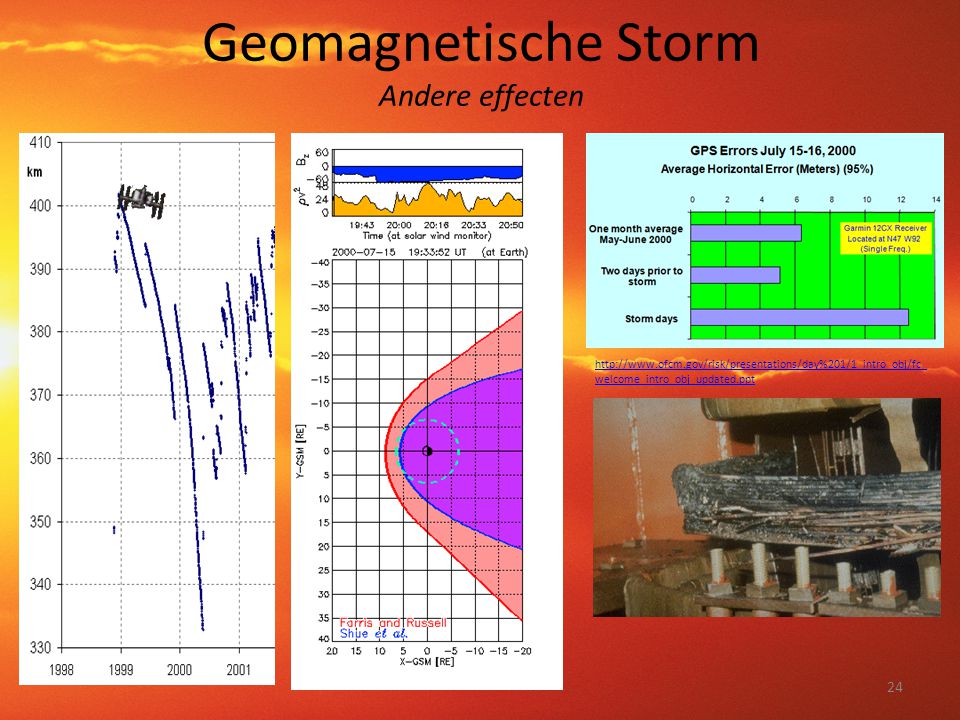
Geomagnetische Storm Andere effecten
25
De voorspelling van een nieuwe zonnecyclus
“The game of the decennium”

26
45 voorspellingsmethoden voor SC24

27
3 soorten methodes Statistische methoden (27) Gemengde methoden (9)
Gemiddelden, periodiciteiten, even/oneven,…. Oorzaak zonnecyclus volledig onbekend Vrij grote onzekerheid Gemengde methoden (9) Koppelen van statistiek aan (geomagnetische) fysische parameter Enkel een aanwijzing over reële oorzaak zonnecyclus Voorzichtig met interpretatie Fysische methoden (9) Zonnemagnetisme: plasmastromen, zonnedynamo,… Nieuw Dienen zich nog te bewijzen
 Koppelen van statistiek aan (geomagnetische) fysische parameter. Enkel een aanwijzing over reële oorzaak zonnecyclus. Voorzichtig met interpretatie. Fysische methoden (9) Zonnemagnetisme: plasmastromen, zonnedynamo,… Nieuw. Dienen zich nog te bewijzen.")
28
Statistische methoden
Gemiddelde voorgaande zonnecycli Talrijke variaties en parameters Fourier-analyse Gleisberg,… Neurale netwerken Zelflerende modellen Niet-lineaire modellen SC = quasi-periodiek verschijnsel

29
Gemengde methoden De nieuwe cyclus uit zich in de voorgaande SC
Precursor-technieken Geomagnetische storingen Coronale gaten Hathaway (2006) Intense SC24 Maar: Te fel afgeglad Foutief maximum Okt-Nov 2003 Halloween-groepen Matige SC24 IHV-index: Interhour-Variability index
 Intense SC24. Maar: Te fel afgeglad. Foutief maximum. Okt-Nov Halloween-groepen. Matige SC24. IHV-index: Interhour-Variability index.")
30
Fysische methoden Flux Transport Dynamo
Hoge diffusie van magnetische velden Diffusietijd ~ 5 jaar Choudhuri, Nandy,… SC24 Max = 80 +/- 20 Directe meting Sterkte polaire magn. velden Svalgaard Schatten (ondiepe dynamo) VVS WG Zon (poolfakkels) SC24 Max = 75 +/- 15 Lage diffusie van magnetische velden Diffusietijd ~ 200 jaar “Magnetisch geheugen” Dikpati, Gilman,… SC24 Max = 170 +/-20 The “Polar Field Precursor” prediction method (Schatten et al., GRL, 1978) presumes that the strength of the solar magnetic axial dipole determines the size of the following solar cycle. Svalgaard et al., (GRL, 2005) propose to use as a measure of the strength of the dipole its average value over three years following the time of establishment of the annual modulation. During this time, the observed polar fields are stable and well defined. Up and down in polar magnetic field strength is due to tilt of solar poles (+/- 7°) VVS WG Zon vermeld in FAIR SPACE WEATHER FOR SOLAR CYCLE #24 Kenneth Schatten, 2005, GRL => Poor man’s magnetograph
 VVS WG Zon (poolfakkels) SC24 Max = 75 +/- 15. Lage diffusie van magnetische velden. Diffusietijd ~ 200 jaar. Magnetisch geheugen Dikpati, Gilman,… SC24 Max = 170 +/ The Polar Field Precursor prediction method (Schatten et al., GRL, 1978) presumes that. the strength of the solar magnetic axial dipole determines the size of the following solar. cycle. Svalgaard et al., (GRL, 2005) propose to use as a measure of the strength of the. dipole its average value over three years following the time of establishment of the annual. modulation. During this time, the observed polar fields are stable and well defined. Up and down in polar magnetic field strength is due to tilt of solar poles (+/- 7°) VVS WG Zon vermeld in FAIR SPACE WEATHER FOR SOLAR CYCLE #24. Kenneth Schatten, 2005, GRL => Poor man’s magnetograph.")
31
Meeste statistische methoden voorspellen middelmatig maximum
Meeste fysische methoden voorspellen laag maximum Zwakke kamp vs. Sterke kamp Zwakke kamp hecht veel belang aan magnetische velden aan de zonnepolen + hoge diffusie magnetische velden Sterke kamp hecht meer belang aan precursortechnieken van meerdere voorgaande zonnecycli + lage diffusie magnetische velden

32
SC24 Prediction Panel April 2007

33
Verloop van SC24 Het afgelopen zonneminimum
Vlekkenloze maand in Aug 2009: eerste sinds Jun 1913

34
Verloop van SC24 Het afgelopen zonneminimum
Zeer lang en zeer diep R<20: Jan 06 – Okt 10 Rmin = 1,71 Dec 08 = SCMin SC23: 151 maand! Veel vlekkenloze dagen 817 dagen (tot Aug 11) ~ 100 jaar geleden Zwakke cycli 2008 & 2009 Top 5 van jaren met meeste vlekkenloze dagen (sinds 1849) Year #R0 44 In 2010 en 2 in 2011 (14 Jan en 14 Aug 2011)
 ~ 100 jaar geleden. Zwakke cycli & Top 5 van jaren met meeste vlekkenloze dagen (sinds 1849) Year #R In 2010 en 2 in 2011 (14 Jan en 14 Aug 2011)")
35
Verloop van SC24 Het afgelopen zonneminimum
Ook andere parameters Geomagnetisch, Zonnewind, Radioflux, “Zonneconstante”,… Laag, maar niet ongewoon Vlekken verschijnen op normale breedte Zuidelijk halfrond +/- 1 jaar achter op noordelijk Zonneuitbarstingen Slechts 3 C-flares tussen Mei 08 en Jun 09… Year #R0 44 In 2010 en 2 in 2011 (14 Jan en 14 Aug 2011)
")
36
SC24 Prediction Panel Mei 2009
Dr. Dikpati said in an interview, “This is the first time that the Sun’s conveyor-belt has been measured accurately enough for two consecutive cycles (cycles 22 spanning approximately and cycle 23 spanning ). From these data we now know that cycle 22 had a shorter conveyor-belt reaching only to 60-degree latitude, while cycle 23 had a long conveyor-belt extending all the way to the pole.” The conveyor belt of plasma flowing in the chromosphere and photosphere essentially drags along with it the magnetic flux of the Sun. Because the extent of the conveyor belt reached a higher latitude, it took the magnetic flux longer to return to the equator, resulting in the delay of sunspots marking the onset of cycle 24. Dr. Dikpati and her team determined that it wasn’t the speed of the flow of plasma conveyor belt that lengthened the solar cycle, but the extent into higher latitudes, and slower return to the equator. Though the speed of the conveyor belt was a bit higher than usual over the past five years, it also stretched much further than during a normal cycle. Plasma flowing poleward at the solar surface and returning equatorward near the base of the convection zone, called the meridional circulation, constitutes the Sun's conveyor-belt. Just as the Earth's great oceanic conveyor-belt carries thermal signatures that determine El Nino events, the Sun's conveyor-belt determines timing, amplitude and shape of a solar cycle in flux-transport type dynamos. In cycle 23, the Sun's surface poleward meridional flow extended all the way to the pole, while in cycle 22 it switched to equatorward near 60°. Simulations from a flux-transport dynamo model including these observed differences in meridional circulation show that the transport of dynamo-generated magnetic flux via the longer conveyor-belt, with slower return-flow in cycle 23 compared to that in cycle 22, may have caused the longer duration of cycle 23. (GRL, July 2010, Dikpati) "According to our model, the trouble with sunspots actually began in back in the late 1990s during the upswing of Solar Cycle 23," said co-author Andrés Muñoz-Jaramillo of the Harvard-Smithsonian Centre for Astrophysics in Massachusetts. "At that time the conveyor belt sped up." The fast-moving belt rapidly dragged sunspot corpses down to sun's inner dynamo for amplification. At first glance, this might seem to boost sunspot production, but no. When the remains of old sunspots reached the dynamo, they rode the belt through the amplification zone too hastily for full re-animation. Sunspot production was stunted. Later, in the 2000s, according to the model, the Conveyor Belt slowed down again, allowing magnetic fields to spend more time in the amplification zone, but the damage was already done. New sunspots were in short supply. Adding insult to injury, the slow moving belt did little to assist re-animated sunspots on their journey back to the surface, delaying the onset of Solar Cycle 24. Hathaway & Rightmire MC sneller dan tijdens SC23-minimum Geen verhoogde activiteit in SC24 Wat gebeurt er precies aan tachocline? The speed-up was surprising on two levels. First, it coincided with the deepest solar minimum in nearly 100 years, contradicting models that say a fast-moving belt should boost sunspot production. The basic idea is that the belt sweeps up magnetic fields from the sun's surface and drags them down to the sun's inner dynamo. There the fields are amplified to form the underpinnings of new sunspots. A fast-moving belt should accelerate this process. So where have all the sunspots been? The solar minimum of was unusually deep and now the sun appears to be on the verge of a weak solar cycle. Instead of boosting sunspots, Hathaway believes that a fast-moving Conveyor Belt can instead suppress them "by counteracting magnetic diffusion at the sun's equator." He describes the process in detail in Science ("Variations in the Sun's Meridional Flow over a Solar Cycle," 12 March 2010, v327, ). The second surprise has to do with the bottom of the Conveyor Belt. SOHO can only clock the motions of the visible top layer. The bottom is hidden by ~200,000 kilometers of overlying plasma. Nevertheless, an estimate of its speed can be made by tracking sunspots. "Sunspots are supposedly rooted to the bottom of the belt," says Hathaway. "So the motion of sunspots tells us how fast the belt is moving down there." He's done that—plotted sunspot speeds vs. time since 1996—and the results don't make sense. "While the top of the conveyor belt has been moving at record-high speed, the bottom seems to be moving at record-low speed. Another contradiction." Could it be that sunspots are not rooted to the bottom of the Conveyor Belt, after all? "That's one possibility" he notes. "Sunspots could be moving because of dynamo waves or some other phenomenon not directly linked to the belt." What researchers really need is a good look deep inside the sun. NASA's Solar Dynamics Observatory, launched in February 2010, will provide that when its instruments come online later this year. SDO is able to map the sun's interior using a technique called helioseismology. SOHO can do the same thing, but not well enough to trace the Great Conveyor Belt all the way around. SDO's advanced sensors might reveal the complete circuit. Dikpati Meridionale circulatie tot aan de polen Vertraagde de start van de nieuwe SC Behoud van hoog SC24-maximum
. From these data we now know that cycle 22 had a shorter conveyor-belt reaching only to 60-degree latitude, while cycle 23 had a long conveyor-belt extending all the way to the pole. The conveyor belt of plasma flowing in the chromosphere and photosphere essentially drags along with it the magnetic flux of the Sun. Because the extent of the conveyor belt reached a higher latitude, it took the magnetic flux longer to return to the equator, resulting in the delay of sunspots marking the onset of cycle 24. Dr. Dikpati and her team determined that it wasn’t the speed of the flow of plasma conveyor belt that lengthened the solar cycle, but the extent into higher latitudes, and slower return to the equator. Though the speed of the conveyor belt was a bit higher than usual over the past five years, it also stretched much further than during a normal cycle. Plasma flowing poleward at the solar surface and returning equatorward near the base of the convection zone, called the meridional circulation, constitutes the Sun s conveyor-belt. Just as the Earth s great oceanic conveyor-belt carries thermal signatures that determine El Nino events, the Sun s conveyor-belt determines timing, amplitude and shape of a solar cycle in flux-transport type dynamos. In cycle 23, the Sun s surface poleward meridional flow extended all the way to the pole, while in cycle 22 it switched to equatorward near 60°. Simulations from a flux-transport dynamo model including these observed differences in meridional circulation show that the transport of dynamo-generated magnetic flux via the longer conveyor-belt, with slower return-flow in cycle 23 compared to that in cycle 22, may have caused the longer duration of cycle 23. (GRL, July 2010, Dikpati) According to our model, the trouble with sunspots actually began in back in the late 1990s during the upswing of Solar Cycle 23, said co-author Andrés Muñoz-Jaramillo of the Harvard-Smithsonian Centre for Astrophysics in Massachusetts. At that time the conveyor belt sped up. The fast-moving belt rapidly dragged sunspot corpses down to sun s inner dynamo for amplification. At first glance, this might seem to boost sunspot production, but no. When the remains of old sunspots reached the dynamo, they rode the belt through the amplification zone too hastily for full re-animation. Sunspot production was stunted. Later, in the 2000s, according to the model, the Conveyor Belt slowed down again, allowing magnetic fields to spend more time in the amplification zone, but the damage was already done. New sunspots were in short supply. Adding insult to injury, the slow moving belt did little to assist re-animated sunspots on their journey back to the surface, delaying the onset of Solar Cycle page=0%2C0. Hathaway & Rightmire. MC sneller dan tijdens SC23-minimum. Geen verhoogde activiteit in SC24. Wat gebeurt er precies aan tachocline The speed-up was surprising on two levels. First, it coincided with the deepest solar minimum in nearly 100 years, contradicting models that say a fast-moving belt should boost sunspot production. The basic idea is that the belt sweeps up magnetic fields from the sun s surface and drags them down to the sun s inner dynamo. There the fields are amplified to form the underpinnings of new sunspots. A fast-moving belt should accelerate this process. So where have all the sunspots been The solar minimum of was unusually deep and now the sun appears to be on the verge of a weak solar cycle. Instead of boosting sunspots, Hathaway believes that a fast-moving Conveyor Belt can instead suppress them by counteracting magnetic diffusion at the sun s equator. He describes the process in detail in Science ( Variations in the Sun s Meridional Flow over a Solar Cycle, 12 March 2010, v327, ). The second surprise has to do with the bottom of the Conveyor Belt. SOHO can only clock the motions of the visible top layer. The bottom is hidden by ~200,000 kilometers of overlying plasma. Nevertheless, an estimate of its speed can be made by tracking sunspots. Sunspots are supposedly rooted to the bottom of the belt, says Hathaway. So the motion of sunspots tells us how fast the belt is moving down there. He s done that—plotted sunspot speeds vs. time since 1996—and the results don t make sense. While the top of the conveyor belt has been moving at record-high speed, the bottom seems to be moving at record-low speed. Another contradiction. Could it be that sunspots are not rooted to the bottom of the Conveyor Belt, after all That s one possibility he notes. Sunspots could be moving because of dynamo waves or some other phenomenon not directly linked to the belt. What researchers really need is a good look deep inside the sun. NASA s Solar Dynamics Observatory, launched in February 2010, will provide that when its instruments come online later this year. SDO is able to map the sun s interior using a technique called helioseismology. SOHO can do the same thing, but not well enough to trace the Great Conveyor Belt all the way around. SDO s advanced sensors might reveal the complete circuit. Dikpati. Meridionale circulatie tot aan de polen. Vertraagde de start van de nieuwe SC. Behoud van hoog SC24-maximum.")
37
Op weg naar een nieuw Maunderminimum?...
Dalton Minimum Maunder Minimum Periode van (Eddy, 1976) Zo goed als geen zonnevlekken Vrij plots begin, geleidelijke herstel Bevestigd door Hoyt & Schatten (1996) 68% van dagen waargenomen Slechts op 2% van deze dagen waren er zonnevlekken Meestal op het zuidelijke halfrond Maunder Minimum bevestigd John A. Eddy (1976) Aurorae-waarnemingen Zonsverduisteringen Pre-1715: geen melding van corona! Hoyt & Schatten (1995) Bijkomende waarnemingen Dagelijkse waarneming voor periode en na 1820! Isotopen 14C (boomringen) en 10Be (poolijs) bevestigen evenwel bestaan van (langerdurende) zonnecyclus tijdens (een deel van) deze periode Zonnedynamo bleek tijdens deze periode dus nog wel te werken! 11-jarige SC geen permanent kenmerk van vlekkenactiviteit
 Zo goed als geen zonnevlekken. Vrij plots begin, geleidelijke herstel. Bevestigd door Hoyt & Schatten (1996) 68% van dagen waargenomen. Slechts op 2% van deze dagen waren er zonnevlekken. Meestal op het zuidelijke halfrond. Maunder Minimum bevestigd. John A. Eddy (1976) Aurorae-waarnemingen. Zonsverduisteringen. Pre-1715: geen melding van corona! Hoyt & Schatten (1995) Bijkomende waarnemingen. Dagelijkse waarneming voor periode en na 1820! Isotopen 14C (boomringen) en 10Be (poolijs) bevestigen evenwel bestaan van (langerdurende) zonnecyclus tijdens (een deel van) deze periode. Zonnedynamo bleek tijdens deze periode dus nog wel te werken! 11-jarige SC geen permanent kenmerk van vlekkenactiviteit.")
38
Verdwijnen de zonnevlekken tegen 2015?
Livingston & Penn William Livingston en Matthew Penn Lagere magnetische veldsterkte => Hogere temperatuur umbra => zonnevlekken moeilijker zichtbaar Verdwijnen de zonnevlekken tegen 2015?

39
Livingston & Penn Pro & Contra
Beperkt # wrn. Dalende tak SC23 Lineaire extrapolatie? Bv. 1980: 5000 Gauss! Pro Verhouding Radioflux/SSN Leif Svalgaard Percolatietheorie Schatten (2007) Hinode wrn.! Percolatie-theorie Schatten et al. (2007) Nieuwe theorie over de vorming zonnevlekken Grote vlekken ontstaan uit kleinschalige structuren van dezelfde polariteit Basisideeën bevestigd door Hinode (2007) Kan nog niet alle kenmerken van vlekkengroepen verklaren Verder uit te werken
 Hinode wrn.! Percolatie-theorie. Schatten et al. (2007) Nieuwe theorie over de vorming zonnevlekken. Grote vlekken ontstaan uit kleinschalige structuren van dezelfde polariteit. Basisideeën bevestigd door Hinode (2007) Kan nog niet alle kenmerken van vlekkengroepen verklaren. Verder uit te werken.")
40
Wat kan dit betekenen voor SC24?

41
Verloop van SC24 2010: Langzame stijging

42
Verloop van SC24 2010: Langzame stijging
Meestal kleine groepen Eerste M-flare M2,3 op 19 Jan 10 Laatste: 25 Mar 08… 2010: totaal 23 M-flares Eerste proton flare 14 Aug 2010; 14 pfu C4 in NOAA 1093 Veel erupties van fila-menten/protuberansen Armada aan zonnesatellieten?... M2,3-flare van NOAA die zich nog achter de O-rand bevond 665 dagen tussen 2 M-flares 2010 Aug 14/1230 Aug 14/ W/ Aug 14/1005 C4/0F N17W52 109(9)3 2011 Mar 08/0105 Mar 08/ NW/ Mar 07/2012 M3/SF N24W Mar 21/1950 Mar 22/ NW/ N/A N/A N/A 1169 Jun 07/0820 Jun 07/ SW/ Jun 07/0803 M2/2N S21W Aug 04/0635 Aug 05/ NW/ Aug 04/0412 M9/2B N15W Aug 09/0845 Aug 09/ NW/ Aug 09/0805 X6/2B N17W Sep 23/2255 Sep 26/ NE/ Sep 22/1101 X1/2N N11E NOAA MH - 19 Oct-01 Nov 2010
 Mar 08/0105 Mar 08/ NW/ Mar 07/2012 M3/SF N24W Mar 21/1950 Mar 22/ NW/ N/A N/A N/A Jun 07/0820 Jun 07/ SW/ Jun 07/0803 M2/2N S21W Aug 04/0635 Aug 05/ NW/ Aug 04/0412 M9/2B N15W Aug 09/0845 Aug 09/ NW/ Aug 09/0805 X6/2B N17W Sep 23/2255 Sep 26/ NE/ Sep 22/1101 X1/2N N11E NOAA MH - 19 Oct-01 Nov")
43
Verloop van SC24 2010: Langzame stijging

44
Complexe globale uitbarsting 01 augustus 2010
From the SIDC On Aug 01, a series of solar events gave rise to a combination of Earth-directed halo CME's. We screen the event based on SDO and STEREO-Ahead movies, and ACE data. What is peculiar is the fact that the accompagnied flare was only of a moderate class. It was a combination of different events in a fast sequence. In a way of speaking, all the energies involved in each process added to each other and resulted in a final energetic impact on Earth. The August 01 event, triggered two Earth directed CME's. In a coronograph STEREOA/HI1, the second CME follows the first CME very close. One could even argue that there is only one CME: the second one overtook the first one. This is called CME cannibalism. The plasma structure can be followed in STEREOA/HI2 up to the arrival of a first shock at Earth on Aug 03 just before 17:00UT. This shock arrival is detected by ACE and visible in all solar wind parameters as a sudden jump. A second structure passed ACE on Aug 04 around 10:00UT. This magnetic structure could be eventually brought back to the second CME. In this case, the first CME was not completely eaten by the second one. The arrival of the CME's on Aug 03 and 04, triggered a minor storm and active conditions lasting up to Aug 05. SIDC

45
Complexe globale uitbarsting 01 augustus 2010

46
Verloop van SC24 Jan-Apr 2011

47
Verloop van SC24 Jan-Apr 2011 Plotse toename in SSN
29,6 in Feb => 55,8 in Mar Niet uitzonderlijk Afgegladde toename SSN Jul/Aug 10: 1,07 SC24 Max: 78 +/- 20 Onzekerheid! Eerste X-flares van SC24 15 Feb; X2,2; NOAA1158 1524 dagen geleden 14 Dec 06; X1,5; NOAA0930 09 Mar; X1,5; NOAA1166

48
NOAA 1158

49
X2,2-flare van 15 Feb 11 Flare veroorzaakte communicatiestoringen in Korea (dagzijde; +/- 10h lokaal) CME had snelheid van 700 km/s Bereikte aarde 3 dagen later, was zeer sterk (30nT) maar de tegengestelde richting van aards magneetveld => Zwakke geomagnetische storing (Kp=5 gedurende slechts 3 uur)
 maar de tegengestelde richting van aards magneetveld. => Zwakke geomagnetische storing (Kp=5 gedurende slechts 3 uur)")
50
X2,2-flare van 15 Feb 11 PROBA-2 (http://sidc.oma.be/)
Gelanceerd op 02 Nov 09 met intercontinentale ballistische raket Klein, goedkoop, in polaire baan (terminator) Gebouwd in België (firma VERHAERT Space) Eerste ESA-satelliet voor zonnewaarnemingen ten behoeve van het ruimteweer Innoverende ruimtetechnologieën (technologische demonstratie) PROBA = Project for onboard Autonomyy - Krachtige computer die zelf onafhankelijke de beslissingen neemt (navigatie, herkenning ruimteweer-events,…) 2 instrumenten onder leiding van de KSB SWAP (Sun Watcher with Active Pixels and Image Processing) - Combineert gedetailleerde EUV-beelden (Corona) met een zeer groot beeldveld LYRA (LYman-alpha RAdiometer ) - Photo-detectoren gebruiken diamant i.p.v. optische filters om rest van EM-spectrum weg te filteren (=> beter en scherper beeld)
 Gebouwd in België (firma VERHAERT Space) Eerste ESA-satelliet voor zonnewaarnemingen ten behoeve van het ruimteweer. Innoverende ruimtetechnologieën (technologische demonstratie) PROBA = Project for onboard Autonomyy. - Krachtige computer die zelf onafhankelijke de beslissingen neemt (navigatie, herkenning ruimteweer-events,…) 2 instrumenten onder leiding van de KSB. SWAP (Sun Watcher with Active Pixels and Image Processing) - Combineert gedetailleerde EUV-beelden (Corona) met een zeer groot beeldveld. LYRA (LYman-alpha RAdiometer ) - Photo-detectoren gebruiken diamant i.p.v. optische filters om rest van EM-spectrum weg te filteren (=> beter en scherper beeld)")
51
X1,5-flare van 09 Mar 11 GONG – Arizona (back-up station)
")
52
Indrukwekkende CME’s Meestal van de aarde weggericht
M3,7 – NOAA1164 Klein proton-event (50pfu); CME had snelheid van 2200 km/s (!) Stereo A geraakt (zonder erg); kleine geomagnetische storm Kleine geomagnetische storingen (Kp=5) op 10-11 Maart 2011 M3,7 – NOAA1164 – 07 Mar 11 – 20:12UT
; CME had snelheid van 2200 km/s (!) Stereo A geraakt (zonder erg); kleine geomagnetische storm. Kleine geomagnetische storingen (Kp=5) op Maart M3,7 – NOAA1164 – 07 Mar 11 – 20:12UT.")
53
Indrukwekkende CME’s Meestal van de aarde weggericht
SOHO – C2 – 2011 / 03 / 16 – C3,7 – NOAA1169 SDO – AIA / 03 / 19

54
Verloop van SC24 Mei-Jul 2011 – Pauze…

55
Verloop van SC24 Mei-Jul 2011 – Pauze…
Afgeglad SSN voor Januari 2011 (30,27) SC24 Max: 83 +/- 18 Mei /- 10 maanden Geen nieuw Dalton-minimum
 SC24 Max: 83 +/- 18. Mei /- 10 maanden. Geen nieuw Dalton-minimum.")
56
Meeting van de AAS/Solar Physics Division Las Cruces, New Mexico, USA – 12-16 Juni 2011
Zon op weg naar een winterslaap? (1/3) Livingston, Penn, Svalgaard Sterkte B in zonnevlekken met 500 Gauss gedaald in laatste decennium Als trend zich verderzet: Geen zonnevlekken meer tegen +/
 Livingston, Penn, Svalgaard. Sterkte B in zonnevlekken met 500 Gauss gedaald in laatste decennium. Als trend zich verderzet: Geen zonnevlekken meer tegen +/")
57
Meeting van de AAS/Solar Physics Division Las Cruces, New Mexico, USA – 12-16 Juni 2011
Zon op weg naar een winterslaap? (2/3) Dick Altrock “Rush to the poles” (nog) niet ingezet Laat SC24-maximum => mogelijk ook zwak
 Dick Altrock. Rush to the poles (nog) niet ingezet. Laat SC24-maximum => mogelijk ook zwak.")
58
Meeting van de AAS/Solar Physics Division Las Cruces, New Mexico, USA – 12-16 Juni 2011
Zon op weg naar een winterslaap? (3/3) Rachel Howe & Frank Hill Jetstream SC25 nog niet aanwezig Zeer late en zeer zwakke SC25
 Rachel Howe & Frank Hill. Jetstream SC25 nog niet aanwezig. Zeer late en zeer zwakke SC25.")
59
De grote zonne-uitbarsting van 07 Juni 2011 M2,5 – H-alpha (GONG – Udaipur) – 05:45-08:45UT
 – 05:45-08:45UT")
60
De grote zonne-uitbarsting van 07 Juni 2011 SDO/AIA & SOHO/C2
NASA/Goddard Space Flight Center -

61
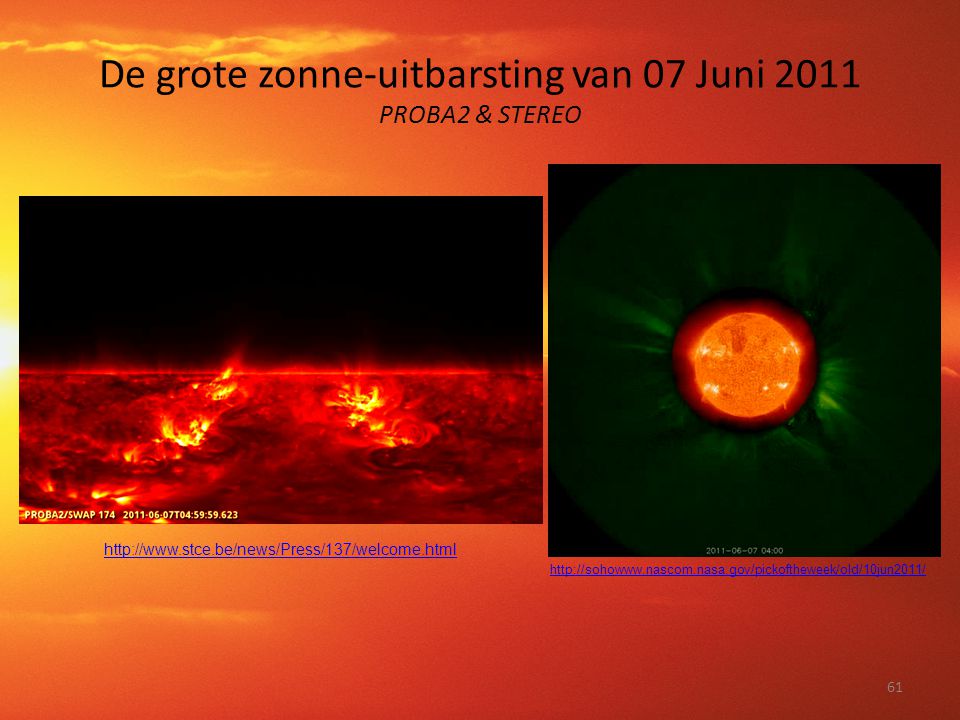
De grote zonne-uitbarsting van 07 Juni 2011 PROBA2 & STEREO
62
Verloop van SC24 Aug-Nov 2011

63
Verloop van SC24 Aug-Nov 2011 Belangrijke toename in activiteit
Niet ongewoon SC24 Max eerder dan 83-18

64
Zonneactiviteit 15 Juli-12 Nov 2011
Begin Aug (left=>right): 22 Aug: 1271 5 Sep: 1283 12 Sep: 1289 19 Sep: 1298 25 Sep: 1302 11 Okt: 8 Nov: 1339
: Aug: Sep: Sep: Sep: Sep: Okt: Nov:")
65
5 grootste groepen van SC24
YY MM DD NOAA Long Lat Elong Area Class Flare 2011 11 4 11339 102 19 -45 1540 Super X1 9 24 11302 282 12 -47 1300 3 11166 91 52 770 Big 5 11164 165 34 M3 8 11263 301 17 18 720 X6

66
Grote, Super en Reuzegroepen
NOAA – 04 Nov 11 1540 MH NOAA – 29 Okt 03 2610 MH NOAA 5395 – 17 Mar 89 3600 MH Grwch – 08 Apr 47 4380 MHc

67
Verloop van SC24 Aug-Nov 2011 Toename in aantal zonneuitbarstingen
SC24 dusver: 123 M en 8 X-flares

68
Top 10 sterkste flares in SC24
X6,9 is 36ste plaats op lijst van krachtigste zonne-uitbarstingen sinds start GOES-metingen (1976)
")
69
Zonne-uitbarstingen X6,9 – 09 augustus 2011 – NOAA1263

70
Zonne-uitbarstingen X1,8 – 07 september 2011 – NOAA1283

71
Zonne-uitbarstingen X1,4 & M3,7 – 22&25 september 2011 – NOAA1302
In 4 dagen (22-25 Sep): 18 M en 2 X-flares! Mostly from NOAA 1302
: 18 M en 2 X-flares! Mostly from NOAA")
72
Zonne-uitbarstingen X1,9 & M7,1 – 24 september 2011 – NOAA1302

73
Aurorae september-oktober 2011
ISS – 17 september 2011 – Madagascar & Noord Australië Maksim Braude – 26 september Rusland 17 Sep: C2 nabij NOAA 1289 (halo CME met snelheid van 600 km/s) 26 Sep: X1, M7, M5 en M3 flares op 24 Sep van NOAA 1302 In 4 dagen (22-25 Sep): 18 M en 2 X-flares! 24 Okt: M1 in NOAA 1314 op 22 Oct (partial halo 500 km/s; massive CME) Lakefxnet – 24 oktober Michigan, USA Stephen Locke – 24 oktober 2011 – Kansas, USA How to train your dragon – Romantic Flight – John Powell
 26 Sep: X1, M7, M5 en M3 flares op 24 Sep van NOAA In 4 dagen (22-25 Sep): 18 M en 2 X-flares! 24 Okt: M1 in NOAA 1314 op 22 Oct (partial halo 500 km/s; massive CME) Lakefxnet – 24 oktober Michigan, USA. Stephen Locke – 24 oktober 2011 – Kansas, USA. How to train your dragon – Romantic Flight – John Powell.")
74
Wat heeft SC24 nog te bieden? SSN-maximum eerste helft 2013 (83+/- 18)
")
75
Wat heeft SC24 nog te bieden? Grote, super en reuzegroepen
Voor een SC24-maximum van 83: 34 grote, 12 super en 3 reuzegroepen Ook na het maximum (dalende tak) SC Rmax Tot B S G Tot Stijg 12 78, 13 89, 14 63, 15 112, 17 119, 18 161, 19 208, 20 111, 21 167, 22 162, 23 125, Tot y = 0,876x - 23, , (5) B y = 0,4947x - 7, , (3) S y = 0,3236x - 15,032 0, (2) G y = 0,0577x - 1,124 0, (0)
 SC Rmax Tot B S G Tot Stijg , , , , , , , , , , , Tot y = 0,876x - 23,564 0, (5) B y = 0,4947x - 7,4072 0, (3) S y = 0,3236x - 15,032 0, (2) G y = 0,0577x - 1,124 0, (0)")
76
Wat heeft SC24 nog te bieden? M- en X-flares
Voor een SSN-maximum van 83: 713 M en 88 X-flares Tot 06 Nov 11: 123 M en 8 X-flares SSN M X waarvan >X10 SC21 167, SC22 162, SC23 125, SC ? Tot 30 Okt: 111 M en 7 X-flares

Verwante presentaties


 DoelgroepVerzondenOntvangen% LG wonen en dagbesteding.>")


 Quiz Night !>")