Download de presentatie
De presentatie wordt gedownload. Even geduld aub

0
Masterclass Computer Graphics en Visualisatie dr. ir. D. H. R
Masterclass Computer Graphics en Visualisatie dr.ir. D.H.R. Holten, SynerScope B.V. dr.ir. C.M.E. Willems, SynerScope B.V. Image sources are properly cited in the notes of the original PPTX-file on each page. If this is not the original file or if notes have been deleted, please do not distribute.

1
Visualisatie “The use of computer-supported, interactive, visual representations of abstract data to amplify cognition” (Card et al., 1999)
")
2
Visualisatie “The use of computer-supported, interactive, visual representations of abstract data to amplify cognition”

3
Wiliam Playfair 1786 1801

4
Charles Joseph Minard 1896

5
Visualisatie “The use of computer-supported, interactive, visual representations of abstract data to amplify cognition”

6
Ivan Sutherland 1963

7
1896

8
Visualisatie “The use of computer-supported, interactive, visual representations of abstract data to amplify cognition”

9
Hoeveel data is er wereldwijd?
Byte Kilobyte Megabyte Gigabyte Terabyte Petabyte Exabyte Zettabyte Yottabyte

10
De hoeveelheid data wereldwijd in 2010
Byte Kilobyte Megabyte Gigabyte Terabyte Petabyte Exabyte 0,988 Zettabyte Yottabyte

11
Visualisatie “The use of computer-supported, interactive, visual representations of abstract data to amplify cognition”

12
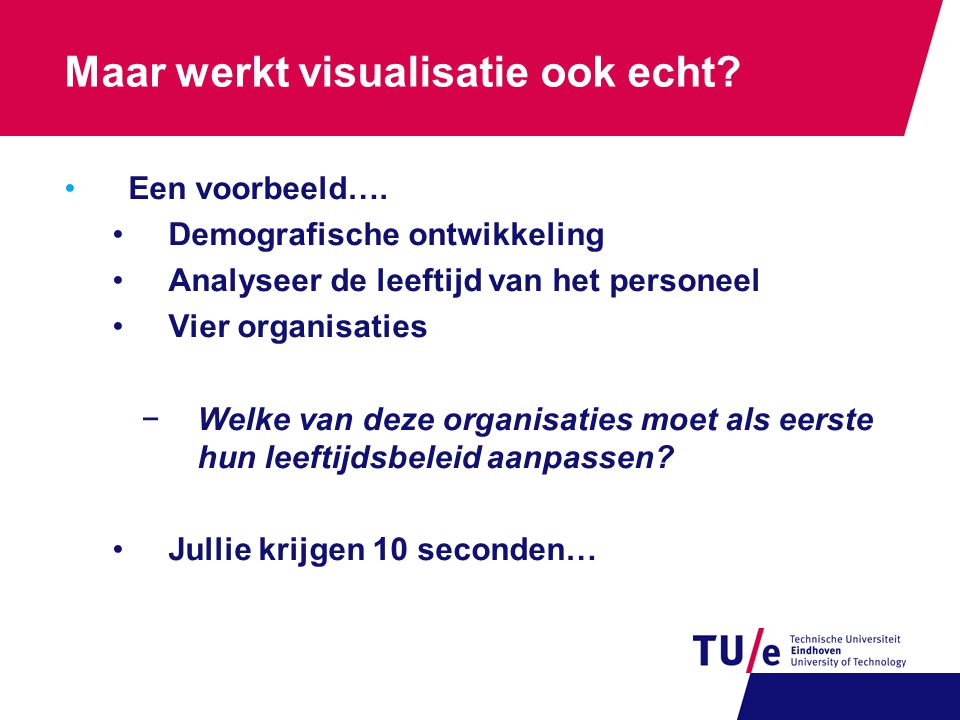
Maar werkt visualisatie ook echt?
Een voorbeeld…. Demografische ontwikkeling Analyseer de leeftijd van het personeel Vier organisaties Welke van deze organisaties moet als eerste hun leeftijdsbeleid aanpassen? Jullie krijgen 10 seconden…

14
Maar werkt visualisatie ook echt?
En nu kijken we 10 seconden naar een visualisatie hiervan…

16
Waarom werkt visualisatie?
Het menselijke visuele systeem is erg goed in het herkennen van patronen. We hoeven niet te zoeken, we zien veel dingen meteen (pre-attentive). De visualisatie ondersteunt het geheugen van de gebruiker.
. De visualisatie ondersteunt het geheugen van de gebruiker.")
17
Waarom werkt visualisatie?
Zelfs op de basisschool krijgen kinderen al taartdiagrammen! De visualisaties werken als een communicatie platform. Je kunt er naar wijzen. ‘Die links boven’ ‘De rode cirkel’

18
De data bepaalt de visualisatie
Wanneer gebruik je een taartdiagram? Wanneer gebruik je een staafdiagram?

19
Verschillende soorten visualisaties

20
Scatterplots (2 variabelen)
Detecteer correlaties, patronen, trends, etc. b a

21
Scatterplots (2 variabelen)
Scatterplots vertellen meer dan lineaire regressie b b b a a a

22
Parallelle coördinaten
De assen staan parallel aan elkaar Punten worden lijnen b Y X Y X b a a b a

23
Voorbeeld parallelle coördinaten

24
Radarplots c b d a e f Zet de assen in een stervorm
Punten worden polygonen c b d a e f

25
Iconification Beeld multidimensionale data af op eigenschappen van een grafisch object: iconen of glyphs. Een beroemd voorbeeld: Chernoff faces (1973)
")
26
Chernoff faces

27
Graph Visualization Node-link diagrams Erg moeilijk!
Dit is een heel eigen vakgebied.

28
Node link

29
Node link

30
Node link (Van Ham, 2004)
")
31
MatrixView (Van Ham, 2003)
")
32
Tree Visualization Boomdiagram Treemap Cushion treemap Beam tree
Botanical tree

33
Tree diagram 365 leaves, 729 nodes

34
Treemap (Shneiderman, 1990)
")
35
Cushion treemap (Van Wijk, 1999)
")
36
Beam Tree (Van Ham, 2002)
")
37
Botanic tree (Kleiberg, 2001)
")
38
Combinaties van data Multivariate data en bomen Bomen en grafen …

39
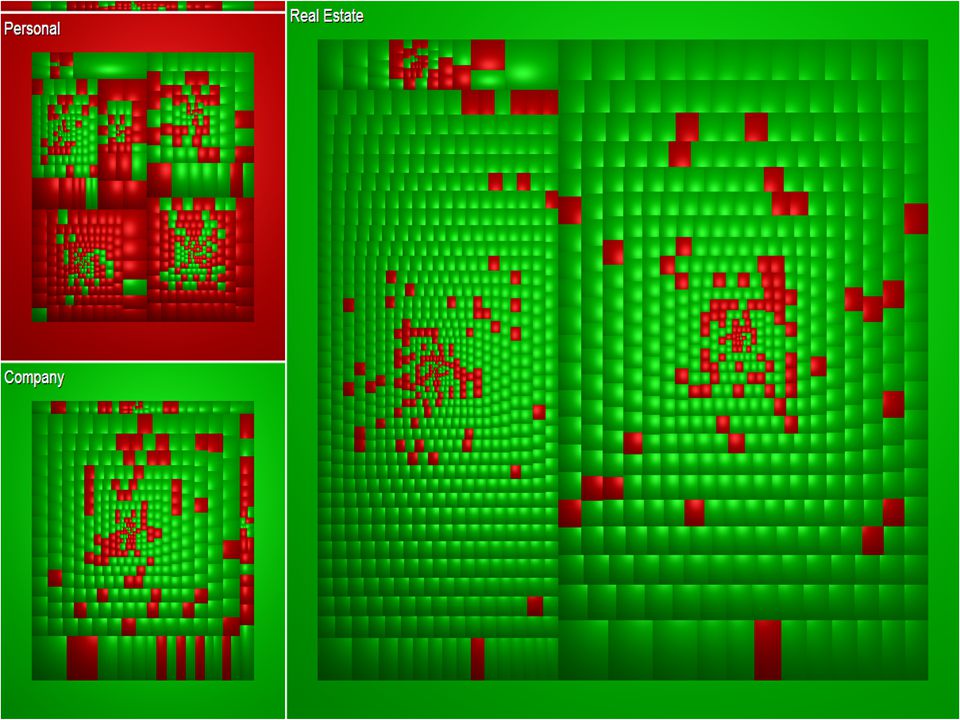
Map of the Market (Wattenberg, 1999) http://www. smartmoney
 smartmoney")
40
Hierarchical Edge Bundles (Holten, 2006): tree + graph
: tree + graph")
41
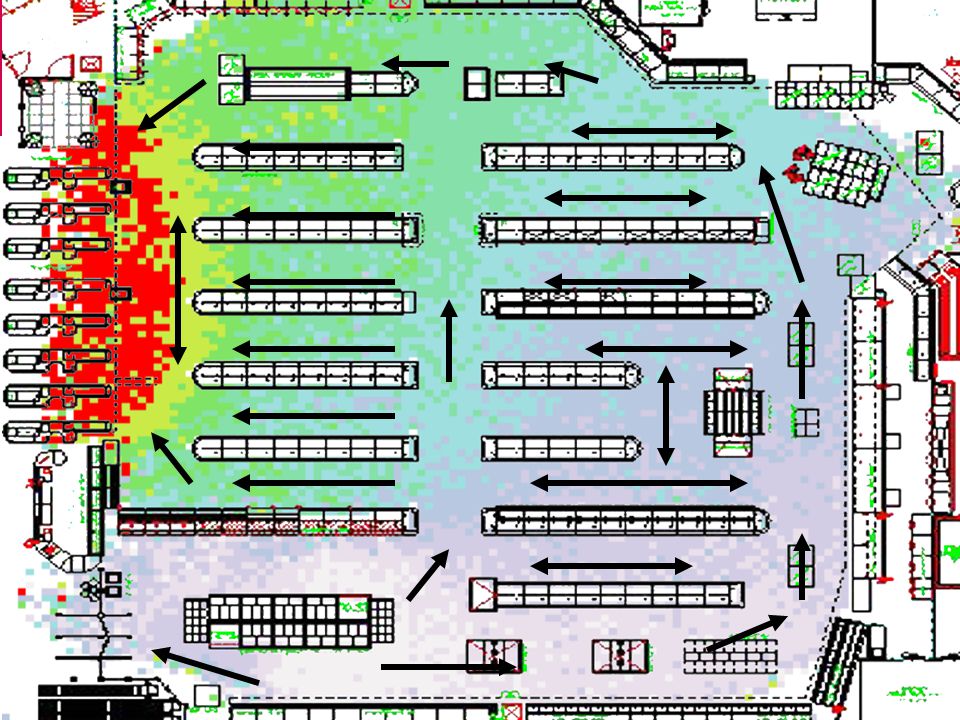
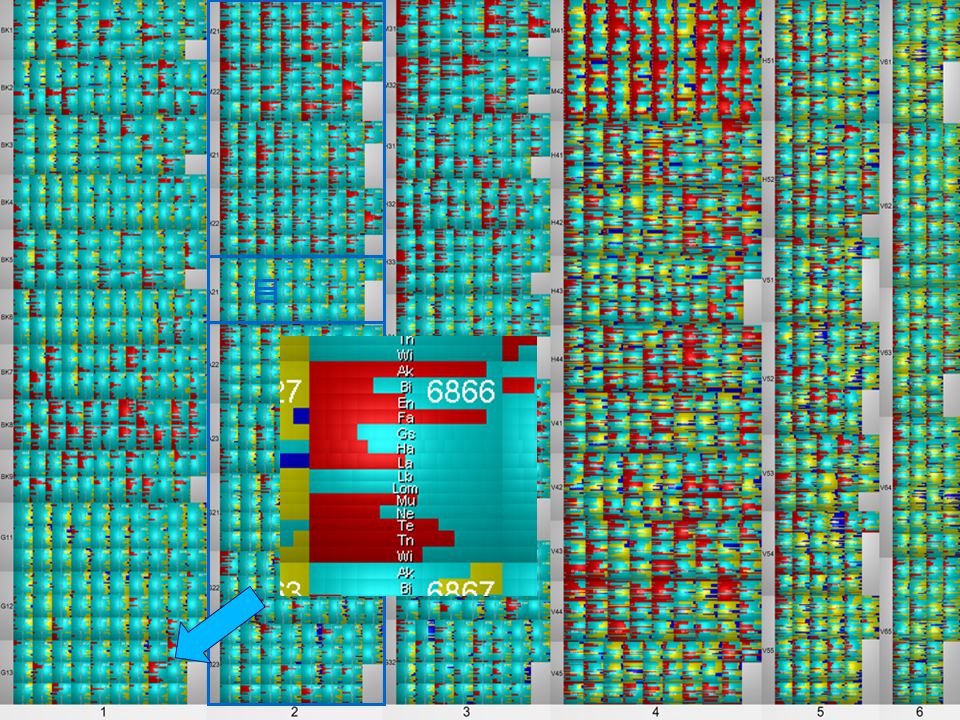
Clustering Time series
(Van Wijk, 1999)
")
42
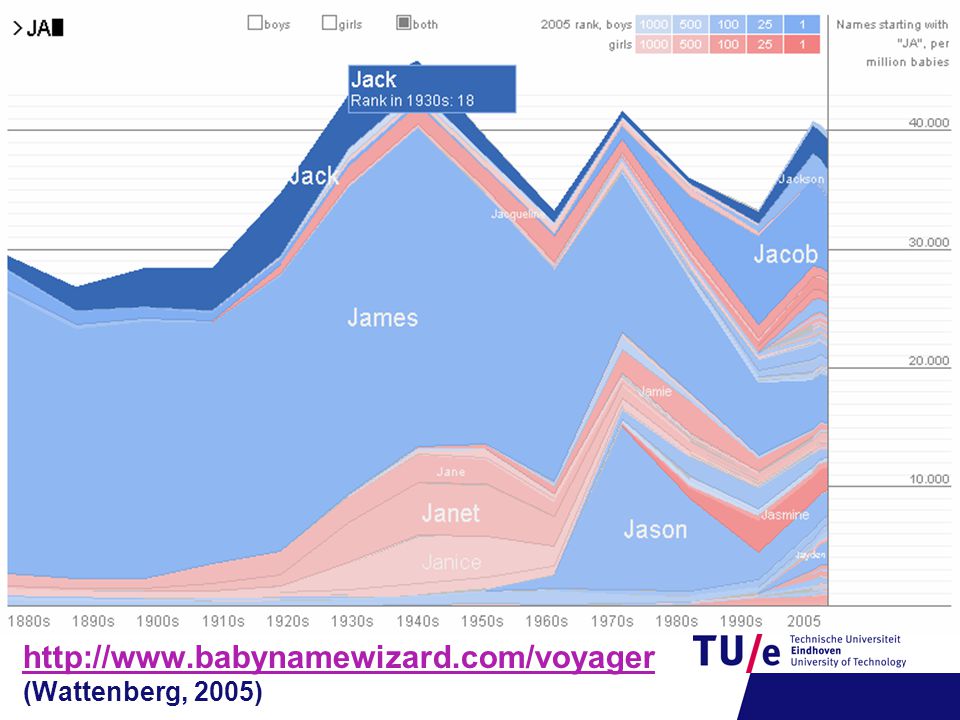
http://www.babynamewizard.com/voyager (Wattenberg, 2005)
")
44
Van tabel naar boom structuur
Naam Geslacht Woonplaats Roel M Eindhoven Ingrid V Sjef Nuth Mia Wouter Opa Walem Oma Familie V M Nuth Eindhoven Walem Nuth Eindhoven Walem Mia Oma Ingrid Oma Sjef Wouter Roel Opa

45
Levels: geslacht/woonplaats
Familie Level 1 : Geslacht V M Level 2 : Woonplaats Nuth Eindhoven Walem Nuth Eindhoven Walem Level 3 : Personen Mia Oma Ingrid Oma Sjef Wouter Roel Opa

46
Levels: woonplaats/geslacht

47
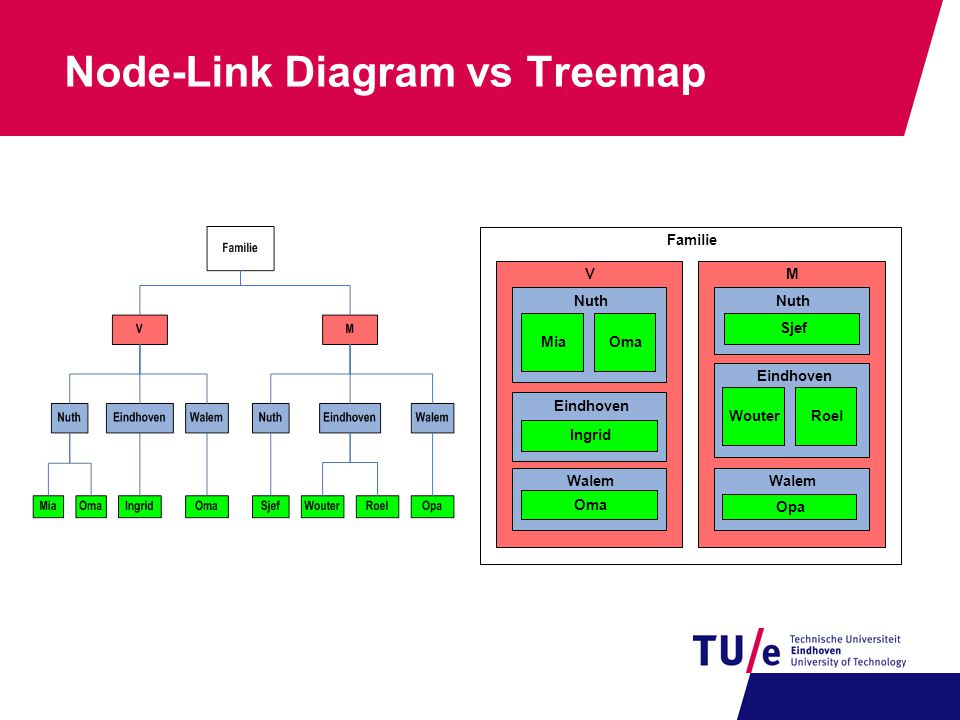
Node-Link Diagram vs Treemap
Familie V M Nuth Nuth Sjef Mia Oma Eindhoven Eindhoven Wouter Roel Ingrid Walem Walem Oma Opa

50
(Arrows added manually)
")
Verwante presentaties


![Deltion College Engels C1 Spreken [Edu/003] thema “Oprah at Deltion” can-do : kan duidelijke, gedetailleerde beschrijving geven van complexe onderwerpen,](/8/2033280/big_thumb.jpg "Deltion College Engels C1 Spreken [Edu/003] thema “Oprah at Deltion” can-do : kan duidelijke, gedetailleerde beschrijving geven van complexe onderwerpen,>")


![Deltion College Engels C1 Gesprekken voeren [Edu/002]/ subvaardigheid lezen thema: Order, order…. can-do : kan een bijeenkomst voorzitten © Anne Beeker.](/8/2048322/big_thumb.jpg "Deltion College Engels C1 Gesprekken voeren [Edu/002]/ subvaardigheid lezen thema: Order, order…. can-do : kan een bijeenkomst voorzitten © Anne Beeker.>")


