Download de presentatie
De presentatie wordt gedownload. Even geduld aub

1
ESERO workshop 6 november 2013 Paul Feldbrugge Ele
De Zon ESERO workshop 6 november 2013 Paul Feldbrugge Ele

2
? Hoeveel sterren bevinden zich in deze HUDF afbeelding
Getal van Avogadro: 6,022*1023 mol-1 In een bol met een straal van 1 m passen ca. 1,257*106 rechthoekjes van ca 10mm2 (zijden van ca 3 mm) Het Hubble Ultra Deep Field (HUDF) is een opname van een klein deel van de hemel in het sterrenbeeld Oven gemaakt door de Hubble Space Telescope. Deze opname was tot 2012 de diepste (langdurigste en verste) van een deel van de hemel die ooit gemaakt is. In 2012 werd het Hubble Extreme Deep Field gepubliceerd door NASA wat een klein gedeelte van het Hubble Ultra Deep Field bevat. Het Hubble Ultra Deep Field bevat meer dan sterrenstelsels en beslaat 11 boogminuten. Dit is slechts een derde van de straal van de volle maan, gezien vanaf de aarde. Dus: teken op je nagel een rechthoekje van ca 3x3 mm. Dit rechthoekje bevat ca x = 1015 sterren. Hou je nagel ca. een meter van je vandaan. Over de gehele hemelbol zijn er dan ca * 1,1257*106 = 1,38. *1021 sterren. Geschat aantal zandkorrels op aarde: ca. 1*1020. Dus waarschijnlijk meer sterren in het heelal dan er zandkorrels zijn op aarde, maarrrrrrrrr………… minder dan het aantal moleculen in een liter water (Avogadro - 6,022*1023 mol-1 met 1 mol water is 18 gram)! Bron: Andere getallen: Zie NVON-blad okt 2013 pag. 372 (artikel van Andre van der Hoeven – Astrofotografie) In een bol met een straal van 1 m passen ca. 1,257*107 rechthoekjes van ca 1 mm2 (zijden van ca 1 mm) Deze opname was tot 2012 de diepste (langdurigste en verste) van een deel van de hemel die ooit gemaakt is. In 2012 werd het Hubble Extreme Deep Field gepubliceerd door NASA wat een klein gedeelte van het Hubble Ultra Deep Field bevat. Het Hubble Ultra Deep Field bevat meer dan zichtbare sterrenstelsels. Dus: teken op je nagel een rechthoekje van ca 1x1 mm. Dit rechthoekje bevat ca x = sterren. Hou je nagel ca. een meter van je vandaan. Over de gehele hemelbol zijn er dan ca * 1,1257*107 = 6, sterren. Geschat aantal zandkorrels op aarde: ca. 1*1020. Dus waarschijnlijk meer sterren in het heelal dan er zandkorrels zijn op aarde, maarrrrrrrrr………… minder dan het aantal moleculen in een liter water (Avogadro - 6,022*1023 mol-1 met 1 mol water is 18 gram)!
 Het Hubble Ultra Deep Field (HUDF) is een opname van een klein deel van de hemel in het sterrenbeeld Oven gemaakt door de Hubble Space Telescope. Deze opname was tot 2012 de diepste (langdurigste en verste) van een deel van de hemel die ooit gemaakt is. In 2012 werd het Hubble Extreme Deep Field gepubliceerd door NASA wat een klein gedeelte van het Hubble Ultra Deep Field bevat. Het Hubble Ultra Deep Field bevat meer dan sterrenstelsels en beslaat 11 boogminuten. Dit is slechts een derde van de straal van de volle maan, gezien vanaf de aarde. Dus: teken op je nagel een rechthoekje van ca 3x3 mm. Dit rechthoekje bevat ca x = 1015 sterren. Hou je nagel ca. een meter van je vandaan. Over de gehele hemelbol zijn er dan ca * 1,1257*106 = 1,38. *1021 sterren. Geschat aantal zandkorrels op aarde: ca. 1*1020. Dus waarschijnlijk meer sterren in het heelal dan er zandkorrels zijn op aarde, maarrrrrrrrr………… minder dan het aantal moleculen in een liter water (Avogadro - 6,022*1023 mol-1 met 1 mol water is 18 gram)! Bron: Andere getallen: Zie NVON-blad okt 2013 pag. 372 (artikel van Andre van der Hoeven – Astrofotografie) In een bol met een straal van 1 m passen ca. 1,257*107 rechthoekjes van ca 1 mm2 (zijden van ca 1 mm) Deze opname was tot 2012 de diepste (langdurigste en verste) van een deel van de hemel die ooit gemaakt is. In 2012 werd het Hubble Extreme Deep Field gepubliceerd door NASA wat een klein gedeelte van het Hubble Ultra Deep Field bevat. Het Hubble Ultra Deep Field bevat meer dan zichtbare sterrenstelsels. Dus: teken op je nagel een rechthoekje van ca 1x1 mm. Dit rechthoekje bevat ca x = sterren. Hou je nagel ca. een meter van je vandaan. Over de gehele hemelbol zijn er dan ca * 1,1257*107 = 6, sterren. Geschat aantal zandkorrels op aarde: ca. 1*1020. Dus waarschijnlijk meer sterren in het heelal dan er zandkorrels zijn op aarde, maarrrrrrrrr………… minder dan het aantal moleculen in een liter water (Avogadro - 6,022*1023 mol-1 met 1 mol water is 18 gram)!")
3
Het heelal is dus spannend…..
In den beginne was er niets……… + verhaaltje over dimensies: waar houdt de ruimte op en wanneer begon de tijd?

4
Ruimte-onderwerpen Planetenonderzoek Leven in de ruimte Communicatie
Onderzoek naar de zon/ sterren Onderzoek van melkwegstelsels Bedreigingen vanuit de ruimte Chelyabinsk ( ) 14 februari 2012 is de NL satelliet “SES-4” van de Nederlandse operator New Skies Satellites BV gelanceerd. Planetenonderzoek: o.a. Mars (Pathfinder) Communicatie: geostationaire banen In November wordt de GAIA-satelliet gelanceerd voor astrometrisch, fotometrisch en spectroscopisch onderzoek van sterren in ons melkwegstelsel Bedreigingen: Chelyabinsk
 14 februari 2012 is de NL satelliet SES-4 van de Nederlandse operator New Skies Satellites BV gelanceerd. Planetenonderzoek: o.a. Mars (Pathfinder) Communicatie: geostationaire banen. In November wordt de GAIA-satelliet gelanceerd voor astrometrisch, fotometrisch en spectroscopisch onderzoek van sterren in ons melkwegstelsel. Bedreigingen: Chelyabinsk")
5
De Ruimte als context voor het onderwijs
ESA: unieke motiverende context voor STEM (Science, Technology, Engineering, Mathematics) subjects ESA geeft toegang tot data, faciliteiten, expertise Internationale (Europese) samenwerking op alle niveaus → bevorder geletterdheid van jongeren in STEM → motiveer hen tot een loopbaan in STEM gerelateerde beroepen! Eerst: De Ruimte als context, waarna we specifiek naar de zon gaan als uitgewerkt voorbeeld. Twee voorbeelden: de Hubble UDF en de lengte van een mens op aarde en bij gewichteloosheid
 subjects. ESA geeft toegang tot data, faciliteiten, expertise. Internationale (Europese) samenwerking op alle niveaus. → bevorder geletterdheid van jongeren in STEM → motiveer hen tot een loopbaan in STEM gerelateerde beroepen! Eerst: De Ruimte als context, waarna we specifiek naar de zon gaan als uitgewerkt voorbeeld. Twee voorbeelden: de Hubble UDF en de lengte van een mens op aarde en bij gewichteloosheid.")
6
ESA – Ondersteuning Formeel: leerkrachtondersteuning
Projectmatig: werken met hoofd hart en handen in extra-curriculaire setting Informeel: vanuit ‘fun’-factor On-line: ESA-Teachers Corner- Solar System Ook: over een aantal jaren kan wel eens 1 leerling per klas de ruimte gaan bezoeken!

7
Lesmaterialen ESERO/ESA: http://www. ruimtevaartindeklas
Voor groep 1/2, 3/4, 5/6, 7/8 Zonnestelsel Leven op aarde De zon in actie Het heelal Ruimtevaart OB Voortgezet Onderwijs Intro Ruimtevaart en Sterrenkunde De Aarde Het heelal Ruimtevaart

8
Lesmaterialen NOVA: http://www. astronomie. nl/#
Venusovergang Zoektocht Exoplaneten Onderzoek de zon Zon en planeten Sterlicht De maan Planeten en leven Kolonie in de ruimte Reis naar Mars Algemene inleiding Astronomie

9
Ook ESERO map voor PO: http://spaceinimages. esa
Zonnestelsel Leven op aarde De zon in actie Bekijk het heelal Naar de ruimte

10
Ons Zonnestelsel

11
Wat is de zon? Continuum (visible) Ontstaan Evenwicht tussen stralingsdruk-gasdruk en gravitatie Stralingstransport Convectie Kernfusie Opgeblazen ballon als demo evenwicht stralingsdruk/gravitatiekracht bij zon en sterren

12
Gebieden binnen de zon 1. Core The Sun has a Core. That is the center layer of the Sun and it is where all the Sun's heat and light is made. 2. Radiative Zone The heat and light move from the core into this next layer Convection Zone In this layer the gases move pretty much like boiling water. This moves them from the inner parts of the Sun to the outer part of the Sun that we see Photosphere This is actually the part of the Sun we can see. This layer gives off the heat and light from the Sun. Cooler parts of this layer make sunspots; those big dark areas Chromosphere This is the fun layer - it shoots out hot gases Corona This layer is like the far, far away uncle we only get to see on special occasions. The Corona can be seen during an eclipse and is the atmosphere around the Sun. Can all of it be this simple? Unfortunately no. I'll give you a very complex example. Sunlight is produced through nuclear reactions in the sun's core. Originally born as energetic gamma rays, after billions of collisions with matter, this radiation reaches the surface and escapes into space. How old is sunlight by the time it reaches the surface? Most textbooks say that it takes light between 100,000 years and 50 million years to escape. You would be surprised to know that this simple, and very popular, question seems to be without a firm answer! The reason has a lot to do with the assumptions that textbook authors use in making the calculation. Most astronomers are also not particularly interested in a high-accuracy answer, so they tend not to bother doing the tedious calculation exactly. It is actually a very complex problem in physics! Once a photon of light is born, it travels at a speed of 300,000 km/sec until it collides with a charged particle and is diverted in another direction. Because the density of the sun decreases by tens of thousands of times from its lead-dense core to its tenuous photosphere, the typical distance a photon can travel between charged particles changes from 0.01 cm at the core to 0.3 cm near the surface. As a comparison, most back-of-the-envelope estimates assume that the sun's interior has a constant density and that the 'free path' distance for the photon is about one centimeter. It is these estimates that find their way into many popular astronomy textbooks.

13
Reis van een foton van binnen naar buiten
Light escapes the sun's core through a series of random steps as it is absorbed and emitted by atoms along the way (Courtesy - Richard Pogge Ohio State U.). Once you know, or assume, a typical distance between collisions, you also have to figure out how many steps the photon has to take to travel from the core to the surface. This is called the Random Walk Problem. The answer is that, if you take a sequence of N random steps, each for example of one meter length, the distance you travel from the starting point will be the square-root of N. After 100 random steps you will travel about 10 meters, but it will take 10,000 steps to travel 100 meters, and one million steps to travel about one kilometer, and so on. Because the density of the sun changes from the core to the surface, it is common to represent the interior of the sun as a collection of nested shells of matter, each with a typical average density. You then calculate how many steps it takes for a photon to travel through each shell. During each step, the photon travels at the speed of light so you can calculate the time required for each step. By multiplying this by the number of steps taken, you can calculate how long it takes the photon to traverse each shell, and then add up all the times for the other shells. When this random walk process is applied to the interior of the sun, and an accurate model of the solar interior is used, most answers for the age of sunlight come out to be between 10,000 and 170,000 years. Rarely do you get answers greater than a million years unless you have made a serious error! Why do you still see these erroneous estimates of '10 million years' still being used? Because textbook authors and editors do not bother to actually make the correct calculation themselves, and rely on older published answers from similar textbooks.
. Once you know, or assume, a typical distance between collisions, you also have to figure out how many steps the photon has to take to travel from the core to the surface. This is called the Random Walk Problem. The answer is that, if you take a sequence of N random steps, each for example of one meter length, the distance you travel from the starting point will be the square-root of N. After 100 random steps you will travel about 10 meters, but it will take 10,000 steps to travel 100 meters, and one million steps to travel about one kilometer, and so on. Because the density of the sun changes from the core to the surface, it is common to represent the interior of the sun as a collection of nested shells of matter, each with a typical average density. You then calculate how many steps it takes for a photon to travel through each shell. During each step, the photon travels at the speed of light so you can calculate the time required for each step. By multiplying this by the number of steps taken, you can calculate how long it takes the photon to traverse each shell, and then add up all the times for the other shells. When this random walk process is applied to the interior of the sun, and an accurate model of the solar interior is used, most answers for the age of sunlight come out to be between 10,000 and 170,000 years. Rarely do you get answers greater than a million years unless you have made a serious error! Why do you still see these erroneous estimates of 10 million years still being used Because textbook authors and editors do not bother to actually make the correct calculation themselves, and rely on older published answers from similar textbooks.")
14
Betekenis van de zon als bron van energie en licht
Aktiviteit: Berekening van het vermogen van de zon met behulp van een gloeilamp van 100 Watt I = P / 4πr2 Berekening vermogen zon.xlsx

15
Enige (opzienbarende) conclusies:
Lzon = 3, Watt Op de aarde valt: ca. 1,4 kW/m2 (dit heet de zonneconstante) Gemiddelde zonnevermogen op de aarde: 1, Watt Gem. energieverbruik aarde: 5, J/jaar (bron: Gemiddeld verbruikt vermogen: 1, Watt M.a.w.: We vangen ruim x zonnevermogen als we met elkaar verbruiken!!!!!!!!
 Gemiddelde zonnevermogen op de aarde: 1, Watt. Gem. energieverbruik aarde: 5, J/jaar. (bron: Gemiddeld verbruikt vermogen: 1, Watt. M.a.w.: We vangen ruim x zonnevermogen als. we met elkaar verbruiken!!!!!!!!")
16
Om een idee te krijgen…………..:
Gemiddelde energie per m2 zonnepaneel: ca. 160 W Benodigde m2 zonnepanelen: ca. 1x10¹¹ m2 Benodigde km2 zonnepanelen: ca. 1x10⁵ km2 Dit is een oppervlakte van ca. 320 x 320 km!

17
De gloeilampen van 100 W zijn eruit!!!!!!!
Maarrrrrrrr…………………… Er zijn er nog wat! Inlichtingen:

18
Kleur en oppervlaktetemperatuur van de zon
Aktiviteit: Waarneming van de kleur van een gloeiende draad van een lamp in samenhang met de temperatuur

19
Kleur en oppervlaktetemperatuur van de zon
Vergelijking met Planck-kromme: (PHET) Ook: virtueelpracticumlokaal λmax*T = kw
 Ook: virtueelpracticumlokaal. λmax*T = kw.")
20
Lichtkracht van de zon L = σT4 (W/m2)
")
21
Samenstelling van de zon

22
Spectra

23
Spectraallijnen als vingerafdruk of barcode van een element

24
Spectra van elementen

25
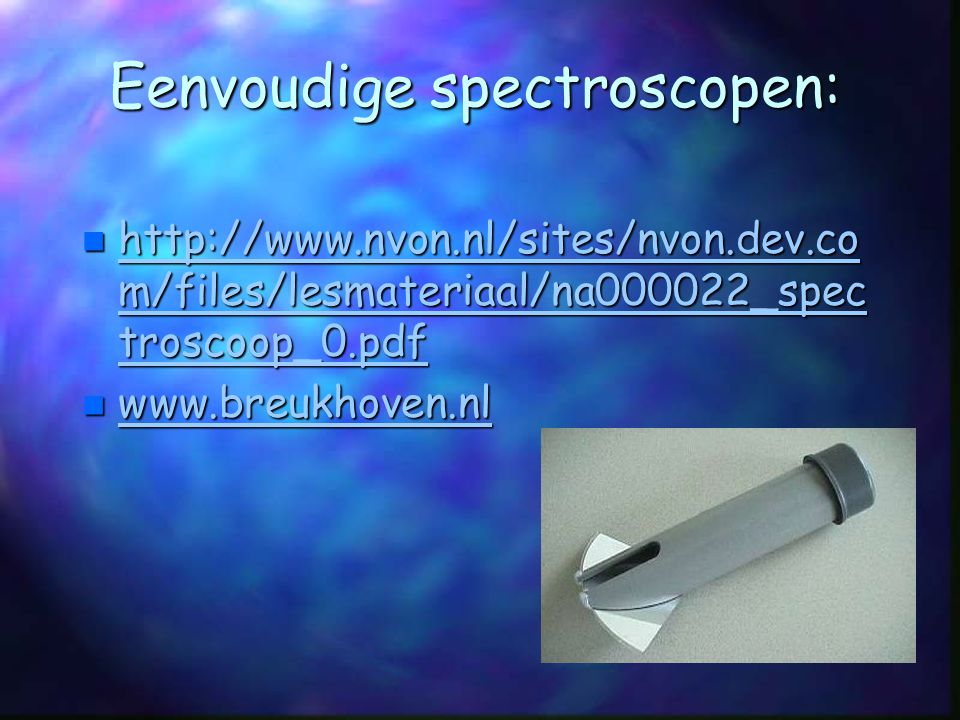
Eenvoudige spectroscopen:
26
Inhouden Toepassing van: Kwadratenwet: I=P/4πr2 Foton: E=h.f = h.c/λ
Planckkromme: Verschuivingswet Wien: λmax*T = kw Sefan-Boltzmann: L = σT4 Continue-, emissie- en absorptiespectra: herkenning elementen a.d.h.v. lijnenpatronen Benodigde concepten: Energie, vermogen Gravitatiekracht, - energie, middelpuntzoekende kracht Optica: prisma, lichtbronnen, lenzen

27
SOHO Valt onder ESA VO-activities
ESA heeft archieven met astronomische data (o.a. van zon, planeten, sterren) ESAC: Europees Virtual Observatory: (
 ESAC: Europees Virtual Observatory: (")
28
SOHO Gelanceerd op 2 december 1995 12 instrumenten
In L1-punt tussen aarde en zon Onderzoek: binnenste van de zon, corona en zonnewind SOHO, the Solar & Heliospheric Observatory, is a project of international collaboration between ESA and NASAto study the Sun from its deep core to the outer corona and the solar wind. SOHO was launched on December 2, The SOHO spacecraft was built in Europe by an industry team led by prime contractor Matra Marconi Space (now EADS Astrium) under overall management by ESA. The twelve instruments on board SOHO were provided by European and American scientists. Nine of the international instrument consortia are led by European Principal Investigators (PI's), three by PI's from the US. Large engineering teams and more than 200 co-investigators from many institutions supported the PI's in the development of the instruments and in the preparation of their operations and data analysis.NASA was responsible for the launch and is now responsible for mission operations. Large radio dishes around the world which form NASA's Deep Space Network are used for data downlink and commanding. Mission control is based at Goddard Space Flight Center in Maryland. SOHO maintains an orbit around the Sun, ~1.5 million km (1 million miles) from Earth at the Lagrangian point (L1).
 under overall management by ESA. The twelve instruments on board SOHO were provided by European and American scientists. Nine of the international instrument consortia are led by European Principal Investigators (PI s), three by PI s from the US. Large engineering teams and more than 200 co-investigators from many institutions supported the PI s in the development of the instruments and in the preparation of their operations and data analysis.NASA was responsible for the launch and is now responsible for mission operations. Large radio dishes around the world which form NASA s Deep Space Network are used for data downlink and commanding. Mission control is based at Goddard Space Flight Center in Maryland. SOHO maintains an orbit around the Sun, ~1.5 million km (1 million miles) from Earth at the Lagrangian point (L1).")
29
SOHO Waarom in de ruimte? http://sohowww.nascom.nasa.gov/home.html
SOHO, the Solar & Heliospheric Observatory, is a project of international collaboration between ESA and NASAto study the Sun from its deep core to the outer corona and the solar wind. SOHO was launched on December 2, The SOHO spacecraft was built in Europe by an industry team led by prime contractor Matra Marconi Space (now EADS Astrium) under overall management by ESA. The twelve instruments on board SOHO were provided by European and American scientists. Nine of the international instrument consortia are led by European Principal Investigators (PI's), three by PI's from the US. Large engineering teams and more than 200 co-investigators from many institutions supported the PI's in the development of the instruments and in the preparation of their operations and data analysis.NASA was responsible for the launch and is now responsible for mission operations. Large radio dishes around the world which form NASA's Deep Space Network are used for data downlink and commanding. Mission control is based at Goddard Space Flight Center in Maryland. SOHO maintains an orbit around the Sun, ~1.5 million km (1 million miles) from Earth at the Lagrangian point (L1).
 under overall management by ESA. The twelve instruments on board SOHO were provided by European and American scientists. Nine of the international instrument consortia are led by European Principal Investigators (PI s), three by PI s from the US. Large engineering teams and more than 200 co-investigators from many institutions supported the PI s in the development of the instruments and in the preparation of their operations and data analysis.NASA was responsible for the launch and is now responsible for mission operations. Large radio dishes around the world which form NASA s Deep Space Network are used for data downlink and commanding. Mission control is based at Goddard Space Flight Center in Maryland. SOHO maintains an orbit around the Sun, ~1.5 million km (1 million miles) from Earth at the Lagrangian point (L1).")
30
Instrumenten aan boord van de SOHO
EIT (Extreme ultraviolet Imaging Telescope). High resolution images of the solar corona in 4 different wavelengths (80,000K to >2 million K): 17.1 nm 19.5 nm 28.4 nm 30.4 nm LASCO (Large Angle and Spectrometric Coronagraph). Mask out the sun and show images of the solar corona: 2 – 6 solar radii, visible 3.7 – 32 solar radii, visible Continuum (visible) Magnetogram MDI (Michelson Doppler Imager). Continuum similar to the ‘naked eye’ view. ESA Teacher Training
. High resolution images of the solar corona in 4 different wavelengths (80,000K to >2 million K): 17.1 nm nm nm nm. LASCO (Large Angle and Spectrometric Coronagraph). Mask out the sun and show images of the solar corona: 2 – 6 solar radii, visible. 3.7 – 32 solar radii, visible. Continuum (visible) Magnetogram. MDI (Michelson Doppler Imager). Continuum similar to the ‘naked eye’ view. ESA Teacher Training.")
31
USING SOHO DATA IN YOUR CLASSROOM
SOHO homepage: Realtime SOHO images: SOHO Viewer App for iPhone & iPad:

32
Zonnevlekken This image is from November 7, 2011 and it shows the large active region On the lower right corner you have a size comparison between Earth, Jupiter and the AR 1339 Zie:

33
Metingen met data van de SOHO
Data-archief: Virtueel waarnemingsprogramma (Aladin): Bekijken van de beweging van zonnevlekken Berekening van de differentiële rotatie op de zon aan de hand van zonnevlekken SOHO in Lagrangepunt 1
: frame=get&id=aladin.jnlp. Bekijken van de beweging van zonnevlekken. Berekening van de differentiële rotatie op de zon aan de hand van zonnevlekken. SOHO in Lagrangepunt 1.")
34
Spectraallijnen en dopplerverschuiving
..\Tr-glv - dopeff - br bew.mpg ..\Tr-glv - dopeff - ontv bew.mpg

35
Rotatie van de zon aan de hand van Dopplerverschuiving: http://www
The principle of this experiment is based on the Doppler-Fizeau effect. The Sun being in rotation, the gas at the Eastern limb moves towards us while the gas at the Western limb moves away from us. By taking a spectrum with the Western limb and another with the Eastern limb, one must be able to observe a shifting of wavelengths if the dispersion of the spectroscope is sufficient. In rounded values, the sun rotates in 25 days at the equator, and a point of its equator courses 4.4 million km during this time. Speed to be measured is thus about 2 km/s. This speed must induce a Doppler shifting about 589*2/ = nm for the yellow line of Sodium. That thus represents a variation of nm between the spectra East (shifted towards blue) and West (shifted towards red). The test that I carried out give values completely comparable and thus confirms the correct operation of my spectro. The measured value of the shifting between the lines obtained on the edges East and West of the Sun is indeed of approximately 0,0075 nm. Notice the lines due to the Earth's atmosphere (indicated by " T") which are not affected by this shifting. Here is another attempt at the same wavelengths, with a better focusing.
 and West (shifted towards red). The test that I carried out give values completely comparable and thus confirms the correct operation of my spectro. The measured value of the shifting between the lines obtained on the edges East and West of the Sun is indeed of approximately 0,0075 nm. Notice the lines due to the Earth s atmosphere (indicated by T ) which are not affected by this shifting. Here is another attempt at the same wavelengths, with a better focusing.")
36
Nuttige internetadressen:
ESA - algemene toegang voor lereran/leerkrachten tot ESA-educatiemateriaal: ESA – Over de zon en het zonnestelsel: Lesmaterialen voor PO en VO: (NOVA)
")
Verwante presentaties


 Les 2: eigenschappen van de planeten (7 t/m 10) Les 3: maten in ons zonnestelsel.>")


